
Quick Summary: Enterprise Facebook ads reporting tools consolidate multi-account Meta campaign data into unified dashboards, automate attribution tracking, and deliver client-ready reports at scale. Top platforms for 2026 include Reporting Ninja ($20/month starting), Whatagraph (custom pricing), Supermetrics (from $69/month), and Looker Studio (free with connector costs). The right tool depends on team size, reporting volume, cross-channel needs, and whether real-time creative insights or MMP integration matter more than cost.
When enterprise teams manage dozens of Facebook ad accounts, native Meta Ads Manager becomes the bottleneck. Spreadsheets break. Different teams see different numbers. And no one fully trusts the attribution data flowing into weekly reports.
That’s the pain driving demand for dedicated Facebook ads reporting tools in 2026. The market spans from free connectors like Looker Studio to end-to-end intelligence platforms charging thousands monthly. Some tools simply pull Meta API data into prettier charts. Others offer predictive creative analytics, MMP attribution reconciliation, and real-time performance alerts.
The gap between basic reporting and enterprise-grade analytics is massive. This guide breaks down 12 Facebook ads reporting platforms built for teams that need accurate data, scale, and attribution they can actually trust.
Demo the Future of Ad Performance with Extuitive
Extuitive operates as a predictive analytics and creative intelligence platform for brands managing Facebook and Instagram advertising. It uses autonomous AI agents and behavioral models to evaluate ad effectiveness and forecast performance before campaigns are launched.
- Predictive scoring of ad creatives based on historical data and consumer simulations.
- Automated reporting dashboards that surface performance patterns across launches.
- Creative analysis that identifies specific visual and text elements driving engagement.
- Cross-channel performance tracking to maintain consistency across social platforms.
- Integration with Shopify for direct product, audience, and ad performance analysis.
Schedule a demo to see how Extuitive can predict your winning ads.
Why Enterprise Teams Need Dedicated Facebook Reporting Tools
Native Meta Ads Manager wasn’t designed for cross-account enterprise reporting. Here’s what breaks at scale:
Attribution gaps widen as campaigns multiply. When running Meta campaigns alongside Google, TikTok, and offline channels, attribution becomes messy fast. Native Facebook reports can’t reconcile with MMP data or CRM conversions. Teams end up with three different ROAS numbers for the same campaign.
Manual exports kill productivity. This includes pulling CSVs, cleaning data, updating spreadsheets, and preparing client-ready reports. For mid-size teams managing multiple accounts, that takes 6-10 hours weekly.
Client visibility demands automation. Agencies managing 20+ client accounts can’t manually compile reports for each. Clients expect real-time dashboard access, white-labeled branding, and automated email delivery—none of which Meta’s native tools provide.
According to competitor source data, agencies maintain 42% better client retention with sophisticated reporting compared to basic reporting. Every lost client from poor reporting means significant financial damage.
Enterprise reporting tools solve these pain points through API automation, cross-platform data blending, and templated dashboards that refresh automatically.
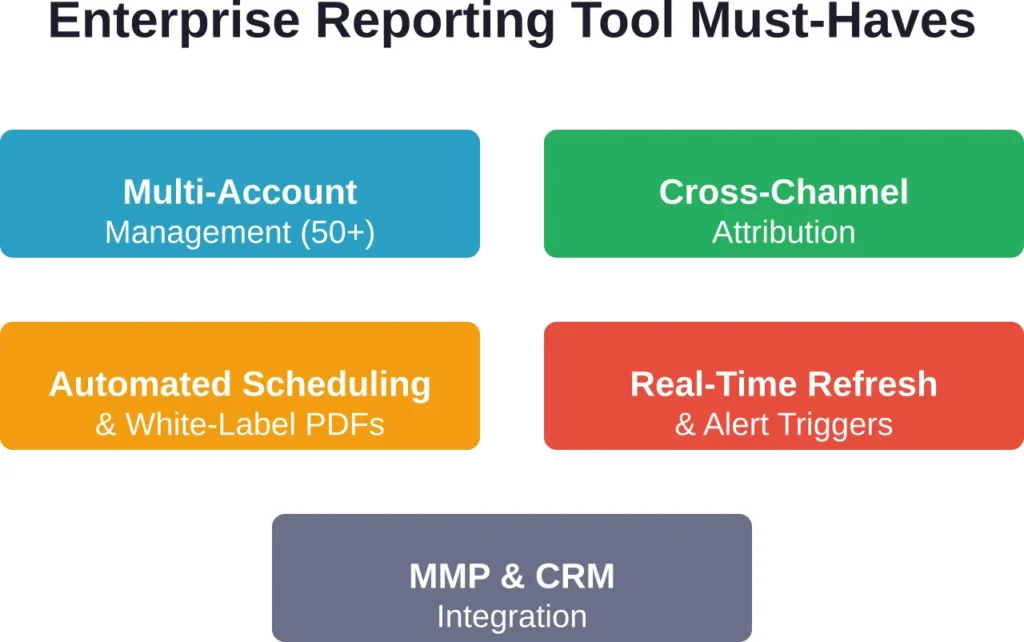
What Defines an Enterprise-Grade Facebook Reporting Tool
Not every dashboard builder qualifies as enterprise-ready. The distinction matters when team size, data volume, and attribution complexity scale beyond basic needs.
Multi-Account Management at Scale
Enterprise tools handle 50+ Facebook ad accounts without performance degradation. They support agency-client hierarchies, role-based access controls, and consolidated views across business units.
Reporting Ninja, for example, offers plans from 10 accounts (Starter at $20/month) up to 150 accounts (Large at $120/month). That capacity matters when a single marketing team manages regional accounts or an agency serves dozens of clients.
Cross-Channel Attribution Integration
Facebook data rarely lives in isolation. Enterprise teams run parallel campaigns on Google, TikTok, and LinkedIn. They need tools that blend Meta data with Google Analytics, CRM conversions, and MMP platforms like Adjust or AppsFlyer.
Tools like Supermetrics and Coupler.io specialize in this. Coupler.io supports 400+ sources for automated data import, enabling true cross-channel reporting.
Automated Reporting and Scheduling
Manual report generation doesn’t scale. Enterprise platforms offer scheduled email delivery, white-label PDF exports, and embeddable dashboards that clients can access 24/7.
DashThis starts at $49/month and specializes in automated client reporting with drag-and-drop templates.
Real-Time Data Refresh and Alerts
Campaign performance shifts hourly. Enterprise tools refresh data automatically—some in real-time, others every 15-60 minutes—and trigger alerts when CPAs spike or ROAS drops below thresholds.
Native Meta reports update daily at best. That lag hides creative fatigue and budget overspend until damage is done.
Top 12 Enterprise Facebook Ads Reporting Tools for 2026
The landscape splits into three tiers: affordable agency platforms, mid-market connectors with BI layers, and high-end intelligence suites. Each serves different scale points and budgets.
1. Reporting Ninja

Reporting Ninja delivers automated Facebook ads reporting with white-label client dashboards and cross-platform data integration. It’s built specifically for agencies and marketing teams managing multiple client accounts.
Core strengths: The platform excels at scheduled report delivery, custom branding, and drag-and-drop dashboard building. Teams can pull Facebook, Instagram, Google Ads, and LinkedIn data into unified client views without coding.
Pricing structure: Plans start at $20/month (Starter) and scale based on account and user count needs. All plans include a 15-day free trial with no credit card required.
Reporting Ninja also supports custom conversion tracking, margin calculations directly in reports, and white-label PDF exports—features agencies need for client billing transparency.
Best for: Marketing agencies managing 10-150 client accounts that need branded, automated reporting without enterprise platform costs.
2. Supermetrics

Supermetrics functions as a data connector rather than a full reporting platform. It pipes Facebook ads data into Google Sheets, Looker Studio, Excel, BigQuery, and major BI tools.
Core strengths: Supermetrics supports 100+ marketing platforms beyond Facebook—Google Analytics, TikTok, LinkedIn, Shopify, and more. Teams building custom dashboards in existing BI tools rely on Supermetrics for the data pipeline.
The tool refreshes data automatically on schedules teams configure (hourly, daily, weekly). It handles large data volumes without API rate limit issues that break manual scripts.
Pricing: Plans start from $69/month for essential connectors. Advanced enterprise features require custom quotes.
Limitations: Supermetrics is not a visualization tool. Teams need separate BI platforms (Looker Studio, Tableau, Power BI) to build dashboards. That adds complexity and cost.
Best for: Teams already invested in BI platforms who need reliable, high-volume data connectors.
3. Looker Studio (Formerly Google Data Studio)

Looker Studio is Google’s free dashboard builder. When paired with connectors like Supermetrics, it creates interactive, cross-channel reports combining Facebook ads data with Google Analytics, Search Console, and CRM sources.
Core strengths: The platform offers drag-and-drop chart building, real-time filtering, and stakeholder-friendly interactive dashboards. Since it’s free, budget-conscious teams favor it for client reporting.
Looker Studio dashboards can be embedded in websites or shared via link. Viewers filter by date range, campaign, or ad set without editing the underlying report.
Cost structure: The core platform is free. But pulling Facebook data requires paid connectors. Data connectors like Supermetrics add $69+/month. So “free” becomes $828+ annually once data sources are connected.
Limitations: Building complex dashboards takes time. There’s a learning curve for blending datasets, writing calculated fields, and troubleshooting connector issues. Teams without BI experience often struggle.
Best for: Budget-conscious teams willing to invest setup time in exchange for zero software licensing fees.
4. Whatagraph

Whatagraph targets marketing agencies with multi-client reporting needs. The platform automates data collection from Facebook, Google, Instagram, and 40+ sources, then delivers white-labeled reports to clients automatically.
Core strengths: Whatagraph’s drag-and-drop editor lets agencies build branded dashboards fast. Automated email delivery means clients receive performance updates without manual work.
The platform includes performance benchmarking, goal tracking, and anomaly detection—features that help agencies spot issues before clients do.
Pricing: Professional plans include custom pricing that scales with client count and data sources.
Best for: Established agencies prioritizing client experience and willing to pay premium pricing for polished, automated reporting.
5. DashThis

DashThis simplifies agency reporting with pre-built templates for Facebook ads, Google Ads, and 30+ platforms. Agencies duplicate templates, connect data sources, and send branded dashboards to clients.
Core strengths: Speed. DashThis prioritizes fast setup over deep customization. Templates cover common reporting needs—campaign performance, cost per result, ROAS—without requiring BI expertise.
The platform includes white-label branding, automated scheduling, and CSV exports for clients who want raw data.
Pricing: Plans start at $49/month for 3 dashboards. Per-dashboard pricing makes cost predictable as client counts grow.
Limitations: Limited customization depth. Teams needing complex calculated metrics or custom data blends will hit platform limits.
Best for: Small agencies (5-15 clients) needing fast, template-driven reporting without extensive customization.
6. Coupler.io
Coupler.io is an ETL (extract, transform, load) platform that automates data exports from Facebook ads into Google Sheets, BigQuery, Excel, and data warehouses. It focuses on raw data automation rather than visualization.
Core strengths: Coupler.io supports 400+ sources—far beyond just Facebook. Teams building custom data pipelines or feeding warehouses rely on its scheduling and transformation features.
The platform handles large datasets without manual intervention. Scheduled exports run automatically, and historical data backfills are straightforward.
Pricing: Plans start at $32/month (Starter), scaling to $132/month (Active) and $259/month (Pro) based on data source count and refresh frequency.
Limitations: No native visualization. Teams need separate dashboarding tools to make sense of the data Coupler.io delivers.
Best for: Data teams building custom analytics stacks who need reliable ETL automation across many platforms.
7. AgencyAnalytics

AgencyAnalytics bundles reporting, SEO auditing, and call tracking into one agency management platform. Facebook ads reporting sits alongside Google rankings, website analytics, and client communication tools.
Core strengths: The all-in-one approach reduces tool sprawl. Agencies manage SEO, PPC, and social reporting from a single login. White-label dashboards and automated reports streamline client communication.
Pricing: AgencyAnalytics pricing varies based on client count and features.
Best for: Full-service agencies offering SEO, PPC, and social media management who want unified client reporting.
8. Databox
Databox connects 70+ data sources—including Facebook ads, Google Analytics, HubSpot, and Salesforce—into mobile-friendly dashboards with goal tracking and performance scorecards.
Core strengths: Mobile-first design. Databox dashboards look sharp on phones, making it easy for executives to check campaign performance on the go. The platform includes built-in goals, benchmark comparisons, and alert notifications.
Databox also offers a free tier with limited data sources, making it accessible for small teams testing reporting automation.
Limitations: Per-seat pricing adds up quickly. Premium analytics features sit behind higher-tier plans, which can become expensive for larger teams.
Best for: Teams prioritizing mobile access and goal-based performance tracking.
9. Swydo
Swydo serves marketing agencies with automated reporting, client dashboards, and workflow tools. The platform emphasizes reliability and uptime—critical when clients expect reports to arrive on schedule every week.
Core strengths: Swydo emphasizes connector reliability and support responsiveness as platform strengths. Agencies tired of connector outages value that stability.
The platform includes report scheduling, white-label branding, and a template library covering common agency use cases.
Pricing: Base plans start at $69/month for the first 10 data sources, with tiered pricing for additional sources.
Best for: Agencies prioritizing connector uptime and support responsiveness over cutting-edge features.
10. Windsor.ai

Windsor.ai specializes in marketing attribution by connecting ad platforms (Facebook, Google, TikTok) with analytics tools (Google Analytics, Looker Studio, Power BI, Tableau) and data warehouses (BigQuery, Snowflake).
Core strengths: The platform focuses on attribution accuracy. It reconciles Facebook’s native attribution with Google Analytics conversions, helping teams understand true cross-channel ROAS.
Windsor.ai offers tiered pricing options.
Best for: Performance marketers running cross-channel campaigns who need accurate attribution across Facebook, Google, and other paid channels.
11. Vaizle
Vaizle combines social media analytics with competitive benchmarking. Teams track Facebook ad performance alongside organic social metrics and competitor activity.
Core strengths: Competitive intelligence. Vaizle monitors competitor Facebook pages, ad creatives, and engagement trends—data most reporting tools omit. That context helps teams understand whether performance gaps stem from internal issues or market shifts.
Pricing: Vaizle offers a 7-day trial for $1 with monthly plans starting at $29.
Best for: Social media managers who need competitive intelligence alongside standard Facebook ads reporting.
12. Improvado

Improvado positions as an end-to-end marketing analytics platform for enterprise teams. It aggregates data from paid ads, CRM, social media, and web analytics into unified dashboards with AI-driven insights.
Core strengths: Enterprise scale. Improvado handles massive data volumes across hundreds of sources without performance issues. The platform includes automated data transformation, cross-channel attribution modeling, and dedicated support.
Pricing: Enterprise-level. Custom quotes typically start in the thousands monthly. The platform targets large marketing teams and agencies managing $100k+ monthly ad spend.
Limitations: Overkill for small teams. The complexity and cost only make sense at true enterprise scale.
Best for: Large enterprises and agencies with $100k+ monthly ad budgets needing end-to-end intelligence platforms with dedicated support.
How to Choose the Right Facebook Reporting Tool for Your Team
The wrong tool creates more problems than it solves. Teams waste time fighting platforms that don’t match their workflow. Here’s how to evaluate fit.
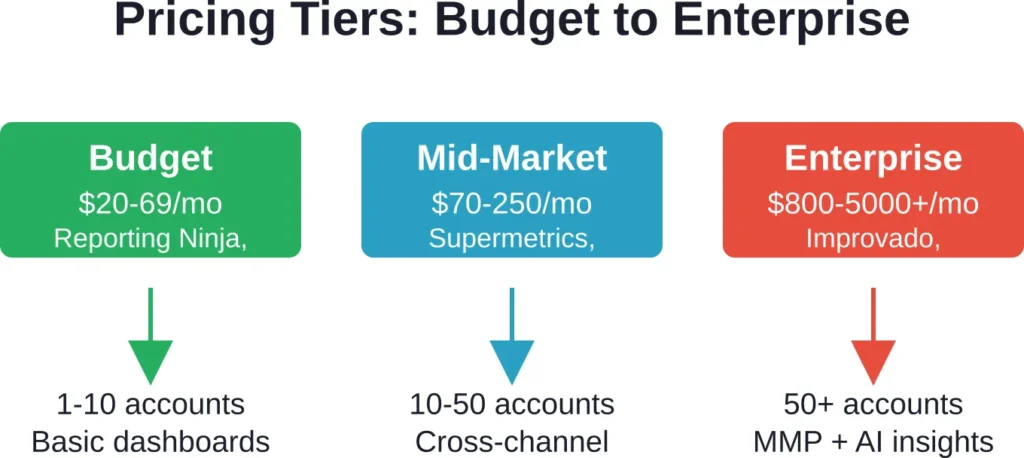
Match Tool Tier to Team Scale
Small teams (1-5 people, under 10 clients) don’t need enterprise platforms. Reporting Ninja’s Starter plan ($20/month for 10 reports and 4 users) or Looker Studio with a basic connector covers most needs.
Mid-size agencies (10-30 clients) hit limits on entry-level plans fast. They need tools like Whatagraph (custom pricing) or Swydo ($69/month base) that scale smoothly as client counts grow.
Large enterprises (50+ accounts, complex attribution) require platforms like Improvado or Supermetrics Enterprise that handle massive data volumes and offer dedicated support.
Prioritize Data Source Coverage
If Facebook ads are the only reporting need, simpler tools suffice. But most teams run multi-channel campaigns. Before committing, verify the platform supports all current and planned data sources—Google Ads, TikTok, LinkedIn, CRM, email marketing, offline conversions.
Coupler.io’s 400+ source support matters when marketing stacks grow complex. Specialized tools with narrow source lists create integration headaches later.
Evaluate Real-Time Needs vs. Cost
Real-time dashboards cost more. If daily or weekly reporting suffices, scheduled exports and static dashboards work fine at lower price points.
But teams optimizing high-spend campaigns hourly need platforms that refresh data every 15-60 minutes and trigger alerts when metrics cross thresholds. That capability typically lives in mid-tier or enterprise platforms.
Consider Internal BI Expertise
Looker Studio is free but demands BI skills. Teams without data analysts struggle with calculated fields, data blending, and troubleshooting connector errors.
Plug-and-play platforms like DashThis or AgencyAnalytics cost more but require minimal technical expertise. The premium pays for ease of use.
Test Before Committing
Most platforms offer free trials. Reporting Ninja provides a 15-day trial with no credit card required. Vaizle offers a $1 seven-day trial.
Use trial periods to test core workflows: connecting Facebook accounts, building dashboards, scheduling reports, and inviting team members. Surface deal-breaker issues before annual contracts lock you in.
Common Pitfalls When Implementing Facebook Reporting Tools
Even the best tools fail when implementation goes wrong. Here are mistakes that derail reporting projects.
Overcomplicating Dashboards
Teams often cram 30+ metrics into dashboards thinking more data means better insights. The result? Nobody looks at them. Stakeholders can’t find key metrics in the clutter.
Effective dashboards focus on 5-8 primary KPIs: ROAS, CPA, spend, conversions, CTR, CPC. Secondary metrics live in drill-down views, not the main screen.
Ignoring Data Accuracy Checks
Automated reporting creates a dangerous assumption: the numbers are always right. They’re not. API changes, attribution model shifts, and connector bugs introduce errors.
Best practice: Spot-check automated reports against native Facebook Ads Manager data weekly for the first month. Verify conversion counts, spend totals, and attribution match expectations.
Skipping Team Training
Buying a tool doesn’t mean the team knows how to use it. Without training, team members revert to manual exports because they don’t understand the platform’s capabilities.
Schedule onboarding sessions. Document common workflows. Create internal templates so team members can duplicate proven dashboard designs instead of building from scratch.
Neglecting Attribution Model Alignment
Facebook offers multiple attribution windows: 1-day click, 7-day click, 1-day view, 28-day click. Reporting tools default to different windows, creating discrepancies between tool reports and native Meta data.
Align attribution settings across platforms before trusting cross-channel reports. Document which attribution model the team uses as the source of truth.
| Feature | Why It Matters | Red Flag If Missing |
|---|---|---|
| Real-time/daily data refresh | Current decisions need current data | Weekly updates = stale insights |
| Cross-channel integration | Holistic attribution across platforms | Facebook-only views miss context |
| White-label branding | Agencies need client-facing reports | Generic branding looks unprofessional |
| Scheduled delivery | Automation saves 10+ hours weekly | Manual exports don’t scale |
| Role-based access | Clients and team members need different views | Single-login systems risk data leaks |
| MMP integration | Reconciles Facebook attribution with app install data | Mobile app marketers need this |
The Role of MMP Integration in Enterprise Facebook Reporting
Mobile measurement partners (MMPs) like Adjust, AppsFlyer, and Kochava track app installs and in-app conversions independently of Facebook’s pixel. For app marketers, MMP data is the source of truth—but it rarely matches Facebook’s native attribution.
That discrepancy creates reporting chaos. Facebook Ads Manager shows 500 installs attributed to a campaign. The MMP reports 320. Which number goes in the client report?
Enterprise reporting tools that integrate MMPs reconcile these differences. They pull both Facebook’s claimed conversions and MMP-verified conversions into unified dashboards, showing the attribution gap explicitly.
Tools like Windsor.ai and higher-tier Supermetrics plans support MMP integrations. Without this capability, app marketers end up manually comparing two datasets in spreadsheets—exactly the problem reporting tools should eliminate.
Creative-Level Reporting: The Missing Layer
Most Facebook reporting tools show campaign and ad set performance. But creative-level insights—which hooks, headlines, or visual elements drive ROAS—require specialized platforms.
Segwise, for example, offers tag-level creative element mapping. Teams tag specific hooks, scenes, or headlines, then see which elements appear in 80% of top-performing creatives. That analysis reveals patterns native Facebook reports miss entirely.
Extuitive takes a different approach with predictive AI. The platform analyzes creative elements before launch, predicting which combinations will outperform. That shifts reporting from reactive (“this ad failed”) to proactive (“don’t launch this creative”).
For teams running dozens of video ad variations, creative-level reporting shortens the path from data to optimization decisions. Standard campaign-level dashboards don’t surface these insights.
Frequently Asked Questions
Data connectors like Supermetrics and Coupler.io extract Facebook ads data and pipe it into separate BI tools (Looker Studio, Tableau, Google Sheets). They don’t build dashboards—they just move data. Full reporting tools like Reporting Ninja or Whatagraph combine data extraction with built-in visualization, templates, and automated delivery. Connectors offer flexibility if teams have BI expertise. Full platforms prioritize ease of use and speed.
Technically yes, but with caveats. Looker Studio itself is free and can build complex dashboards. But pulling Facebook data requires paid connectors (Supermetrics at $69/month minimum). At scale, dashboard performance slows with large datasets. Teams also need BI expertise to troubleshoot connector issues, write calculated fields, and blend data sources. For teams with data analysts, Looker Studio works at enterprise scale. For teams without BI resources, paid platforms like Reporting Ninja or Whatagraph save time.
Attribution mismatches usually stem from different attribution windows. Facebook defaults to 7-day click and 1-day view attribution. Reporting tools may use different windows. Check your tool’s settings and align them with Facebook’s attribution model. For MMP discrepancies (common in app campaigns), recognize that Facebook counts conversions it claims credit for, while MMPs measure actual verified conversions. Both numbers matter—Facebook data guides platform optimization, MMP data measures true performance.
Manual reporting typically consumes 6-10 hours weekly for mid-size teams managing multiple accounts. For agencies, time savings from automation can range from 15-20+ hours monthly, freeing resources for optimization work.
No. Cross-channel platforms like Reporting Ninja, Supermetrics, Whatagraph, and Coupler.io pull data from all major ad platforms into unified dashboards. Using separate tools creates silos and makes cross-channel attribution impossible. That said, specialized tools exist for specific needs—creative analysis, MMP integration, predictive AI. The core reporting layer should be cross-channel; specialized tools supplement when needed.
It depends on campaign velocity. High-spend campaigns ($10k+ daily) benefit from hourly or real-time updates so teams catch budget overspend or creative fatigue immediately. Mid-spend campaigns ($1k-10k daily) work fine with 3-4 hour refresh intervals. Low-spend campaigns (under $1k daily) can use daily updates. Most reporting tools offer configurable refresh rates. Real-time data costs more (in platform pricing and API quota consumption) so balance freshness needs against cost.
Start with budget-tier paid platforms like Reporting Ninja ($20/month Starter) or DashThis ($42/month). Free tools like Looker Studio seem attractive but require BI expertise most small agencies lack. Setup time and ongoing troubleshooting cost more in labor hours than entry-level paid platforms. Paid tools include support, templates, and reliability—worth $20-40 monthly when the alternative is burning 10+ hours monthly fighting free tools. Upgrade to mid-tier platforms (Whatagraph, AgencyAnalytics) once client count exceeds 10-15.
Conclusion: Match Tool Tier to Team Scale and Data Needs
Enterprise Facebook ads reporting isn’t about finding the “best” tool—it’s about matching platform capabilities to team scale, data complexity, and budget reality.
Small teams managing under 10 accounts get the most value from budget-tier platforms like Reporting Ninja ($20-120/month) or connector-plus-BI combinations like Looker Studio with basic Supermetrics. These handle core reporting needs without enterprise platform costs.
Mid-size agencies running 10-50 client accounts need tools that scale smoothly—Whatagraph (custom pricing), Swydo ($69/month base), or AgencyAnalytics. These platforms balance cost against white-label branding, automated scheduling, and multi-client management.
Large enterprises with 50+ accounts, complex cross-channel attribution, and MMP integration requirements should evaluate Improvado, Supermetrics Enterprise, or Coupler.io plus custom BI layers. Expect $800-5000+ monthly costs, but also dedicated support and infrastructure that handles massive data volumes reliably.
The worst mistake? Buying more tool than the team needs or can use. A $3000/month platform doesn’t help if the team lacks data analysts to configure it. Conversely, trying to scale Looker Studio to 50 clients creates reporting chaos.
Start with trial periods. Test core workflows. Verify data accuracy against native Facebook reports. Then commit to annual contracts only after confirming the platform fits team capabilities and growth trajectory.
The right reporting tool transforms Facebook ads data from a spreadsheet headache into a strategic asset. The wrong tool just creates expensive new problems.
Ready to automate your Facebook ads reporting? Start with a 15-day free trial of platforms like Reporting Ninja or request demos from Whatagraph and Swydo. Test with real client data before committing to annual contracts.