
Quick Summary: Amazon Ads reporting tools range from Amazon’s native solutions like Amazon Marketing Stream, Amazon Marketing Cloud, and version 3 reports to third-party platforms like WisePPC, SellerMetrics, Helium 10, Pacvue, and IntentWise. These tools help sellers and advertisers analyze campaign performance, optimize bids, track ACOS, and make data-driven decisions using dashboards, automation, and API integrations.
Managing Amazon Ads without proper reporting tools is like flying blind. The difference between profitable campaigns and budget drain often comes down to how quickly sellers can spot performance shifts and act on them.
Amazon’s advertising ecosystem has grown beyond simple Sponsored Products campaigns. With multiple ad formats, millions in daily ad spend, and constant algorithm changes, manual reporting through spreadsheets simply doesn’t cut it anymore.
The market offers dozens of reporting solutions. Some are built directly by Amazon. Others come from third-party developers who’ve spent years refining analytics for sellers and vendors. Each tool takes a different approach to the same core challenge: turning raw advertising data into actionable insights.
This guide breaks down the landscape of Amazon Ads reporting tools available in 2026, covering both native Amazon solutions and the most capable third-party platforms.
Why Amazon Ads Reporting Tools Matter
Amazon PPC software automates the management of advertising campaigns on Amazon. It connects to Amazon’s API to analyze ad performance, adjust bids, and optimize keywords around the clock, replacing the need for manual spreadsheets and daily login checks in Seller Central.
Here’s the thing though—the Amazon Ads console itself provides reports. But those native reports have limitations.
Standard Amazon reports update slowly, often with 24-48 hour delays. The interface makes it difficult to visualize trends across multiple campaigns. And if you’re managing more than a handful of products, manually downloading and analyzing campaign data becomes a full-time job.
That’s where dedicated reporting tools step in. They pull data through Amazon’s Advertising API, process it faster, and present it in dashboards designed specifically for decision-making. The best tools also correlate advertising spend with organic rank changes, inventory levels, and overall business profitability.
For brands spending thousands per month on Amazon Ads, the right reporting tool typically pays for itself by catching wasteful spend or identifying high-performing keywords that deserve more budget.
Third-Party Amazon Ads Reporting Tools
Third-party software bridges the gap between Amazon’s powerful but complex native solutions and what most sellers actually need: simple dashboards that answer key questions fast.
These tools connect to Amazon’s Advertising API and Selling Partner API to pull data automatically. They then process that data, calculate custom metrics like true profit per product, and present everything in visual dashboards.
The third-party market has exploded. Dozens of companies now offer Amazon advertising analytics. Some focus purely on reporting. Others combine reporting with bid automation and optimization.
Key Features to Look For
Not all reporting tools are built the same. The best ones share certain capabilities that make them genuinely useful rather than just another login to check.
Real-time or near-real-time data sync. Tools that update hourly catch problems faster than those that sync once daily.
Profit-based metrics. ACOS only tells part of the story. Tools that factor in product costs, Amazon fees, and true profit margins provide clearer ROI pictures.
Custom alerts. The ability to set notifications when ACOS spikes, spend accelerates, or campaigns pause saves constant manual checking.
Historical trend visualization. Line charts showing performance over weeks or months reveal patterns that daily snapshots miss.
Cross-campaign analysis. Comparing performance across campaigns, brands, or product categories helps identify what’s working.
Search term analysis. Detailed breakdowns of which customer search queries trigger ads help refine targeting and find negative keyword opportunities.
Multi-user access. For teams and agencies, role-based permissions prevent junior team members from accidentally pausing major campaigns.
Popular Third-Party Tools
Here’s a breakdown of some widely used Amazon Ads reporting platforms as of 2026.
WisePPC
WisePPC focuses on deep Amazon PPC analytics combined with powerful bulk optimization and automation. The platform targets sellers who need long-term historical data and granular insights beyond Amazon’s native 60–90 day limits.
The dashboard offers 30+ metrics with hourly granularity, multi-metric charts, gradient highlighting for quick problem spotting, and advanced filtering by campaign type, match type, placement, and more. Users can perform bulk edits on thousands of targets in seconds and set up rule-based or AI-driven bid automation.
WisePPC works well for small-to-medium and growing sellers who want professional-level reporting and optimization without the complexity of enterprise tools.
Contact Information:
- Website: wiseppc.com
- Facebook: www.facebook.com/people/Wise-PPC/61573154427547
- LinkedIn: www.linkedin.com/company/wiseppc
- Instagram: www.instagram.com/wiseppc
SellerMetrics

SellerMetrics focuses on simple rule-based automation combined with accurate profit analytics. The platform targets sellers who want to move beyond manual spreadsheets without needing complex AI systems.
The dashboard provides clear visualization of campaign performance with profit calculations that account for COGS and fees. Users can set up automation rules like “If ACOS exceeds 30%, lower bid by 10%” or “If a keyword has 10 clicks and 0 sales, reduce bid by 20%.”
SellerMetrics works well for small-to-medium sellers who need straightforward reporting and don’t want to spend hours learning complicated software.
Helium 10

Helium 10 started as a product research and keyword tool but expanded into advertising management. The platform’s Adtomic feature provides Amazon PPC reporting and automation.
Helium 10’s strength lies in integration. Since users often already rely on Helium 10 for keyword research and listing optimization, adding advertising analytics creates a unified workflow. The platform shows how advertising impacts organic rank and BSR movements.
Helium 10 suits sellers who want an all-in-one Amazon toolkit rather than specialized point solutions for each function.
Pacvue

Pacvue targets larger brands and agencies managing significant Amazon advertising budgets across multiple marketplaces. The platform provides enterprise-grade reporting with customizable dashboards, advanced attribution modeling, and portfolio-level analytics.
Pacvue supports not just Amazon but also Walmart, Instacart, and other retail media networks. For brands advertising across multiple channels, this unified reporting saves time compared to logging into separate platforms.
The pricing reflects the enterprise focus—Pacvue typically works with brands spending at minimum tens of thousands monthly on Amazon Ads.
IntentWise

IntentWise combines reporting with AI-powered bid optimization. The platform analyzes campaign data to automatically adjust bids based on performance patterns, time-of-day variations, and inventory levels.
The reporting dashboard emphasizes actionable metrics. Rather than overwhelming users with every possible data point, IntentWise highlights opportunities—keywords ready for bid increases, search terms to add as targets, underperforming placements to exclude.
IntentWise works for sellers who want automation but also appreciate detailed reporting to understand what the algorithms are doing.
Advigator

Advigator simplifies Amazon PPC management through automated campaign creation and continuous optimization. The platform requires minimal technical skills and handles bid adjustments automatically.
The reporting interface provides 24-hour performance views and tracks metrics across Sponsored Products, Display, Brand, and Video campaigns. According to the platform’s documentation, typical campaign bids might run at rates like $1.64 for Sponsored Products, $1.00 for Display, and $1.50 for Brand and Video campaigns.
Advigator targets sellers who want hands-off management with occasional reporting check-ins rather than daily manual optimization.
Sellozo and PPC Entourage


Sellozo and PPC Entourage both focus on algorithmic bid management backed by detailed reporting dashboards. These platforms continuously analyze performance data and adjust bids to maintain target ACOS or maximize profit.
Both tools provide granular search term reports, dayparting analysis, and placement-level breakdowns showing how Top of Search performs versus Product Pages versus Rest of Search.
PPC Entourage has particularly strong search term analytics, making it popular with sellers focused on mining customer search data for insights.
Viral Launch (Kinetic) and Sellerlab (Ignite)


Viral Launch and Sellerlab offer broader Amazon seller toolsets with advertising modules built in. Like Helium 10, this integrated approach appeals to sellers who prefer managing everything in one platform.
Kinetic from Viral Launch and Ignite from Sellerlab both provide automated bidding, campaign creation wizards, and performance dashboards. The reporting isn’t as deep as specialized tools, but it covers the essentials—spend, sales, ACOS, and keyword performance.
Amazon’s Native Reporting Solutions
Also worth understanding what Amazon provides directly. These native solutions have improved dramatically over the past few years.
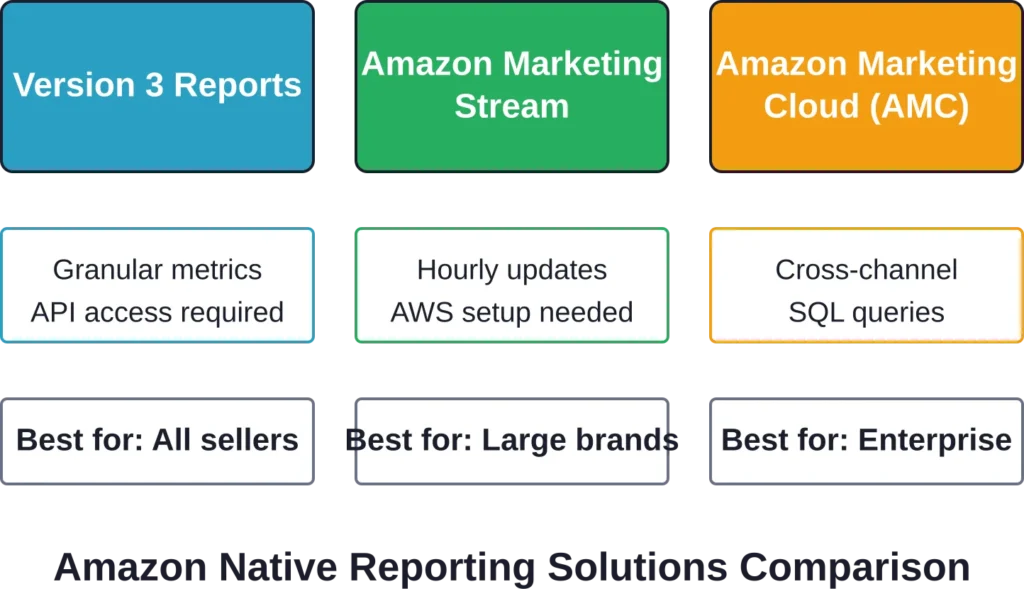
Version 3 Reports

Amazon rolled out version 3 of its reporting API to give advertisers more granular data access. These reports provide detailed breakdowns of Sponsored Products, Sponsored Brands, and Sponsored Display campaigns.
Version 3 reports include metrics like impressions, clicks, spend, sales, ACOS, and ROAS at various levels—campaign, ad group, keyword, product, and search term. The reports support custom date ranges and can be scheduled for automatic delivery.
The challenge? Accessing version 3 reports requires technical knowledge or third-party software. Most sellers still rely on the basic reporting dashboard in the Amazon Ads console, which uses older reporting formats with less flexibility.
Amazon Marketing Stream

Real-time campaign performance visibility empowers Amazon Ads advertisers to seize optimization opportunities the moment they emerge. Amazon Marketing Stream integrated with AWS unlocks powerful business capabilities that transform advertising investments into precision-driven growth engines.
Marketing Stream delivers hourly data updates instead of the typical 24-48 hour delay. According to Amazon’s official documentation, budget change events trigger reports whenever budget allotment changes by 5% or more.
This near-real-time reporting allows advertisers to catch budget pacing issues, respond to viral traffic spikes, and pause underperforming campaigns before they burn through daily budgets.
The catch? Marketing Stream requires AWS infrastructure setup. Advertisers need to configure data ingestion pipelines using services like Amazon S3, AWS Glue, and Amazon QuickSight. For larger brands and agencies, this investment makes sense. For individual sellers, it’s often overkill.
Amazon Marketing Cloud (AMC)

AMC takes a different approach than standard reporting tools. Rather than just showing campaign metrics, it’s a clean room environment for privacy-safe audience analysis and cross-channel measurement.
AMC allows advertisers to combine Amazon Ads data with their own first-party data to build custom audience segments, analyze customer journeys, and measure the impact of advertising across multiple touchpoints.
This becomes particularly valuable for brands running both Amazon Ads and external advertising. AMC can show how display ads on external sites influence Amazon purchases, or how Amazon DSP campaigns affect in-store sales.
Like Marketing Stream, AMC requires technical expertise. Advertisers write SQL queries to analyze data, which puts it out of reach for most small-to-medium sellers. But for enterprise brands, AMC provides measurement capabilities that no third-party tool can match.
Amazon Selling Partner API Reports

Beyond advertising-specific tools, the Amazon Selling Partner API provides access to broader business data that complements advertising reports.
The Selling Partner API includes reports like Market Basket Analysis, Search Terms, and Repeat Purchase behavior. According to Amazon’s official documentation, these reports support different reporting periods—DAY, WEEK, MONTH, or QUARTER for Market Basket Analysis and Search Terms reports, and WEEK, MONTH, QUARTER for Repeat Purchase reports.
Market Basket Analysis shows which products customers commonly purchase together. This data helps advertisers understand cross-sell opportunities and bundle strategies.
Search Terms reports reveal which organic search queries drive traffic to listings, allowing advertisers to discover new keyword opportunities for campaigns.
Accessing Selling Partner API reports requires developer registration, application approval, and technical integration. AWS provides guidance for ingesting Amazon Vendor Central and Amazon Ads data, detailing best practices for creating reporting workflows with AWS Step Functions and storing data in Amazon S3.
Most sellers access this data through third-party tools that handle the API integration behind the scenes.
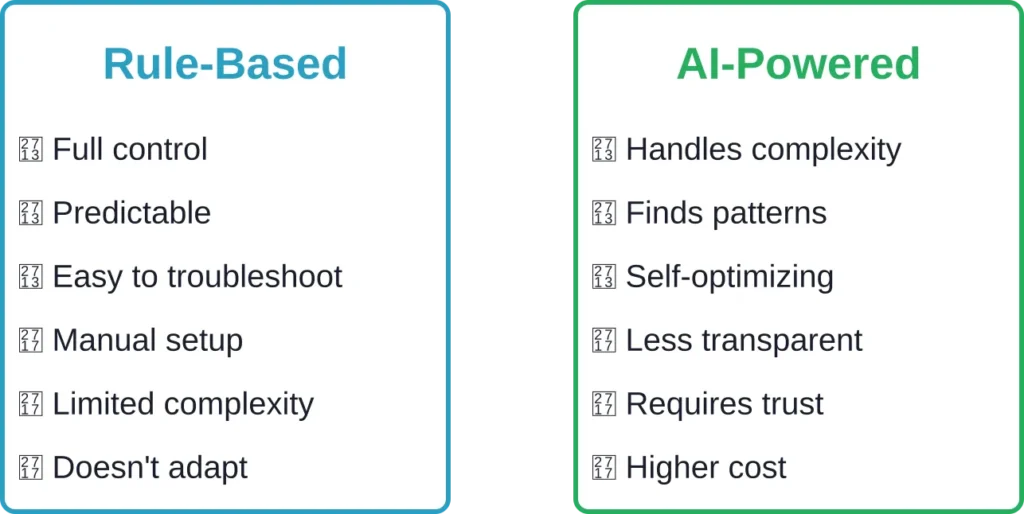
Choosing Between Rule-Based and AI-Powered Tools
The Amazon PPC software market has split into two philosophical camps: rule-based automation and AI-powered optimization.
Rule-based tools let sellers set explicit conditions. “If ACOS is above 35%, decrease bid by 15%.” “If a keyword gets 20 clicks with no sale, pause it.” These rules execute predictably. Sellers know exactly what will happen.
AI-powered tools use machine learning algorithms to identify patterns and make optimization decisions automatically. Rather than following rigid rules, the AI adapts to changing conditions and considers dozens of variables simultaneously.
So which approach works better?
Rule-based systems excel at implementing clear strategies consistently. For sellers who understand their profitability thresholds and have strong opinions about bid management, rules provide full control. And when something goes wrong, it’s easy to diagnose which rule caused the problem.
AI systems handle complexity better. They can spot subtle patterns—like certain keywords performing differently on weekends, or specific products converting better in particular regions. For sellers managing hundreds of campaigns, AI scales better than manually setting rules for every scenario.
The downside of AI? Less transparency. When an algorithm changes bids, it’s not always obvious why. Some sellers find this uncomfortable, especially when algorithm decisions conflict with their intuition.
In practice, many successful sellers use hybrid approaches. They set guardrails with rules—”never bid above $3″ or “always pause keywords with ACOS over 80%”—and let AI optimize within those boundaries.
Software vs Agency Management
Amazon advertising tools represent a do-it-yourself approach. But another option exists: hiring an agency to manage campaigns entirely.
Agencies charge either a percentage of ad spend or flat monthly fees. Typical agency fees range from 10-20% of monthly ad spend, with minimums around $1,000-$2,000 monthly.
Software tools cost much less—usually $50-$500 monthly depending on features and ad spend tiers. The tradeoff? Software requires time and knowledge to use effectively.
Agencies make sense when ad spend exceeds $20,000-$30,000 monthly and the business lacks in-house advertising expertise. At that scale, agency fees become reasonable relative to potential performance improvements.
Software works better for smaller sellers, those with advertising experience, or businesses that prefer maintaining direct control over campaigns. Many sellers start with software and switch to agencies as they scale, or use hybrid models where agencies manage strategy while software handles execution.
Essential Metrics Every Reporting Tool Should Track
Regardless of which tool you choose, certain metrics matter more than others. Focus on these.
ACOS (Advertising Cost of Sale). The percentage of sales revenue spent on advertising. If a product generates $100 in sales from $30 in ad spend, ACOS is 30%.
But here’s the catch—ACOS alone doesn’t show profitability. A 30% ACOS might be fantastic for a high-margin supplement or disastrous for a low-margin electronics accessory.
TACOS (Total Advertising Cost of Sale). Ad spend divided by total sales, including both organic and ad-attributed. TACOS shows advertising’s impact on overall business, not just ad-driven revenue.
ROAS (Return on Ad Spend). The inverse of ACOS. If ACOS is 25%, ROAS is 4x. Some sellers prefer ROAS because higher numbers feel better psychologically.
Attributed sales. Revenue that Amazon attributes to ads within the attribution window. Important for understanding true campaign impact.
Impression share. The percentage of eligible impressions where ads appeared. Low impression share means budget constraints or low bids are limiting visibility.
Click-through rate (CTR). Impressions that result in clicks. Low CTR suggests poor ad relevance or unappealing images and titles.
Conversion rate. Clicks that result in purchases. Low conversion often indicates listing optimization issues rather than advertising problems.
Cost per click (CPC). Average amount paid per click. Tracking CPC trends reveals increasing competition or seasonal bid pressure.
Search term performance. Which customer search queries drive impressions, clicks, and sales. The most valuable reporting insight often comes from search term analysis.
| Metric | What It Shows | Target Range |
|---|---|---|
| ACOS | Ad spend as % of ad sales | 15-35% (varies by margin) |
| TACOS | Ad spend as % of total sales | 5-15% |
| CTR | Ad relevance and appeal | 0.3-0.6% |
| Conversion Rate | Listing quality and pricing | 10-20% |
| CPC | Competitive pressure | $0.30-$2.50 (category dependent) |
| Impression Share | Visibility potential | Above 50% for key terms |
Budget Allocation Insights from Reports
Reporting tools reveal which campaigns deserve more budget and which should scale back. According to industry analysis from Search Engine Journal, a reasonable budget allocation framework might be: Sponsored Products at 50%, Sponsored Brands at 40%, and Product Display Ads at 10%.
This allocation reflects that Sponsored Products typically drive the bulk of sales volume with the most precise targeting. Sponsored Brands build awareness and capture branded search traffic. Display Ads work for retargeting and complementary product discovery.
But every brand is different. Reporting data should drive allocation decisions, not generic formulas.
Watch for campaigns with high ROAS and low impression share. These represent constrained opportunities—increasing budgets would likely capture more profitable sales at similar efficiency.
Conversely, campaigns with deteriorating ACOS and high impression share may have hit their ceiling. Pushing more budget rarely improves performance; better targeting or creative refreshes become necessary.
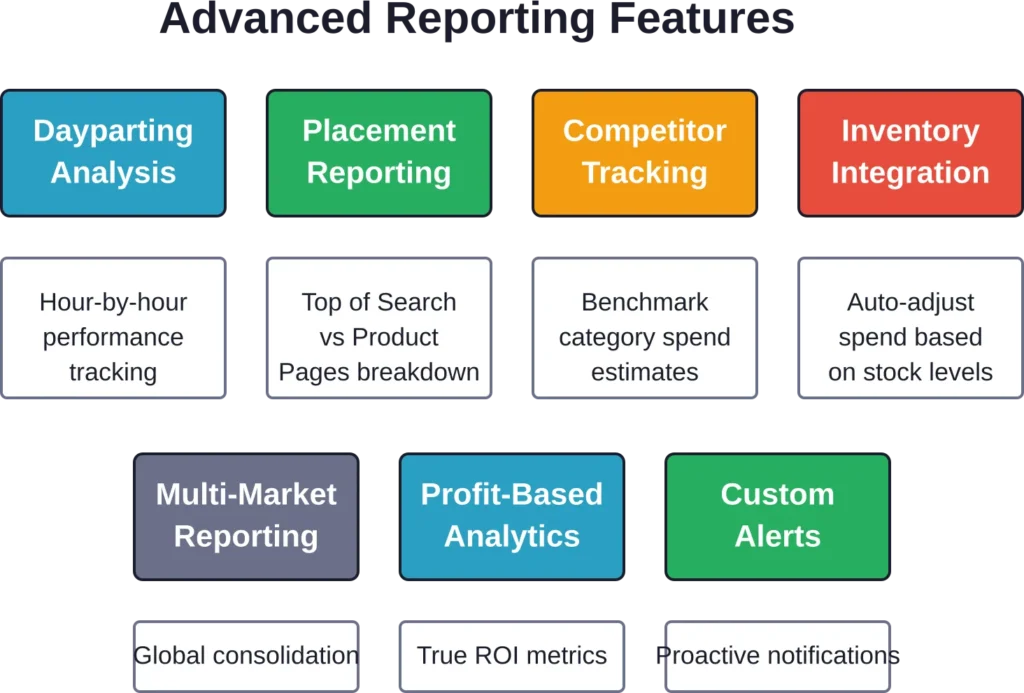
Advanced Reporting Capabilities
The most sophisticated reporting tools go beyond basic metrics to provide strategic insights.
Dayparting Analysis
Some tools track performance by hour or day of week. This reveals when conversion rates peak, allowing advertisers to adjust bids by time period—increasing bids during high-converting hours, decreasing during low-converting periods.
Placement Reporting
Amazon Ads appear in multiple placements: Top of Search, Product Pages, Rest of Search. Performance varies dramatically by placement. Top of Search typically converts best but costs most per click. Product Pages often provide cheap clicks with lower conversion.
Tools that break down performance by placement help optimize placement multipliers—the bid adjustments for each placement type.
Competitor Analysis
Some platforms estimate competitor ad spend and track competitor product rankings in search results. While not perfectly accurate, these estimates help benchmark against category norms.
Inventory-Aware Optimization
The best tools integrate inventory data. When stock runs low, they automatically reduce ad spend to avoid going out of stock and triggering ranking penalties. When inventory arrives, they ramp spend back up.
Multi-Marketplace Reporting
Brands selling internationally need unified reporting across Amazon.com, Amazon.co.uk, Amazon.de, and other marketplaces. Enterprise tools consolidate performance data across regions, converting currencies and normalizing metrics for comparison.
Data Integration and Custom Dashboards
Enterprise sellers often need to combine Amazon Ads data with other business systems—ERP platforms, accounting software, inventory management tools, and BI platforms like Tableau or PowerBI.
Most reporting tools offer export capabilities. CSV downloads work for basic needs. API access allows automated data pulls for integration into data warehouses.
Some tools provide direct integrations with popular platforms. TapClicks, for example, specializes in creating unified marketing dashboards that pull data from Amazon Ads alongside Google Ads, Facebook Ads, and other channels.
For brands running omnichannel advertising, these consolidated dashboards prevent the scattered login problem—checking performance requires opening a single dashboard instead of five separate platforms.
Custom dashboard builders let advertisers choose which metrics matter most and arrange them for quick decision-making. A brand focused on profitability might prioritize profit per unit and TACOS. A brand in growth mode might emphasize impression share and new-to-brand customer acquisition.
Common Reporting Mistakes
Even with powerful tools, sellers make predictable reporting mistakes that undermine decision quality.
Focusing on ACOS alone. A product with 20% ACOS might lose money after accounting for costs. A product with 40% ACOS might generate strong profit if margins are high.
Ignoring attribution windows. Amazon attributes sales for seven days after a click. Fast-moving product sales appear quickly. Big-ticket items may convert days later. Judging campaign performance too quickly misses delayed conversions.
Not segmenting branded vs. generic search. Branded keywords (searches including your brand name) typically convert at much lower cost than generic category searches. Mixing them in aggregate metrics obscures performance.
Overlooking placement differences. A campaign might show 35% ACOS overall but 20% ACOS for Top of Search and 60% ACOS for Product Pages. Aggregate metrics hide optimization opportunities.
Comparing campaigns with different goals. A defensive campaign protecting branded search should have low ACOS. An aggressive conquest campaign targeting competitor brands might run profitably at higher ACOS. Comparing them directly makes no sense.
Reacting to single-day fluctuations. Amazon Ads performance varies daily. One bad day doesn’t mean a campaign broke. Look at rolling seven-day or 14-day trends instead of daily numbers.
Seller-Specific vs. Vendor-Specific Tools
Amazon has two seller models: Seller Central for third-party sellers and Vendor Central for first-party vendors who sell directly to Amazon.
These models require different reporting approaches. Sellers control their own inventory and advertising directly. Vendors sell to Amazon and have less direct control over pricing and availability.
Most third-party reporting tools focus on Seller Central. These tools optimize for metrics sellers care about—profitability per unit, inventory turn, and ACOS relative to margins.
Vendor-focused tools handle different challenges. Vendors care about chargeback avoidance, co-op advertising, and retail analytics. According to Search Engine Journal, Amazon’s Retail Analytics Premium data previously cost vendors $30,000 annually before Amazon made it available free to all Vendor Central users in early 2020.
Some enterprise platforms like Pacvue support both seller and vendor accounts, recognizing that many brands operate hybrid models—selling some products through Seller Central and others through Vendor Central.
Pricing Considerations
Amazon Ads reporting tool pricing varies widely based on features, ad spend tiers, and target customer segments.
Entry-level tools start around $50-$100 monthly for basic reporting and simple automation. These work for sellers spending $1,000-$5,000 monthly on ads.
Mid-tier platforms typically charge $200-$500 monthly and support sellers spending $5,000-$30,000 on ads. These include more sophisticated automation, profit analytics, and multi-user access.
Enterprise tools often use custom pricing based on ad spend volume. Expect costs from $1,000 to $5,000+ monthly for brands spending six figures monthly on Amazon Ads.
Some tools charge percentage-of-spend models—typically 2-10% of monthly ad spend. This scales cost with usage but can become expensive as campaigns grow.
Watch for hidden costs. Some platforms charge setup fees. Others limit historical data access or charge extra for API access, additional users, or premium support.
Free trials help evaluate tools before committing. Most platforms offer 7-30 day trials. Use trial periods to test whether the interface makes sense for your workflow and whether the data accuracy matches expectations.
Setting Up Your First Reporting Dashboard
When implementing a new reporting tool, start simple rather than trying to configure everything immediately.
Connect API credentials first. Most tools require Amazon Advertising API access, which involves creating a developer account and granting permissions. The tool’s documentation typically provides step-by-step instructions.
Let initial data sync complete. Depending on account size and historical data volume, the first sync might take hours or even days. Don’t make optimization decisions until complete historical data loads.
Configure basic alerts. Set notifications for obvious problems—ACOS spikes above profitability thresholds, daily spend exceeding budgets, campaigns pausing unexpectedly.
Create a daily review routine. Spend 10-15 minutes each morning checking key metrics: yesterday’s spend, ACOS trends, top-performing search terms, and any alert notifications.
Add complexity gradually. Once comfortable with basic reporting, add automation rules, custom dashboards, or advanced features like dayparting.
Expert consensus emphasizes that no tool replaces strategic thinking. Software automates execution and surfaces insights, but sellers still need to make strategic decisions about product positioning, competitive differentiation, and overall advertising strategy.
Integration with Broader Amazon Strategy
Advertising reporting doesn’t exist in isolation. The best sellers integrate advertising data with other Amazon success factors.
Listing optimization matters more than bidding strategy. A poorly optimized listing with great traffic from advertising still converts poorly. According to Search Engine Journal, A+ Content has been shown to increase conversion on listings by 7–11%.
Reporting tools that track conversion rates by product help identify listing optimization opportunities. When conversion rates lag category benchmarks despite good traffic, the problem likely sits in images, bullet points, descriptions, or pricing rather than advertising.
Inventory management intersects directly with advertising. Running aggressive campaigns while low on inventory creates out-of-stock situations that damage organic rank. Tools that warn about inventory constraints relative to current advertising pace prevent this.
Review velocity and rating affect both organic and paid performance. Products with strong reviews convert better from ads and rank higher organically. Some reporting platforms correlate review count and average rating with advertising efficiency.
Pricing strategy impacts ACOS directly. A product priced at $25 with $5 in ad spend per sale shows 20% ACOS. Drop the price to $20 and ACOS jumps to 25% even if ad costs stay constant. Reporting tools don’t always account for price changes automatically, so tracking price adjustments helps interpret ACOS fluctuations.
Future Trends in Amazon Ads Reporting
The Amazon advertising ecosystem continues evolving rapidly. Several trends are reshaping reporting capabilities.
Deeper AI integration. Beyond simple bid automation, AI increasingly handles budget allocation across campaigns, keyword discovery from semantic search patterns, and creative optimization through multivariate testing.
Voice and visual search data. As Alexa and visual search grow, reporting tools will need to surface data on how customers discover products through these channels and attribute sales accordingly.
Cross-device attribution. Customers research on mobile and purchase on desktop, or browse on desktop and buy on mobile. Better attribution modeling across devices will improve understanding of customer journeys.
Incrementality measurement. The fundamental question—how much of this sale would have happened anyway without the ad?—remains hard to answer. Incrementality testing and modeling will improve as platforms like Amazon Marketing Cloud become more accessible.
Real-time everything. The gap between data generation and data availability keeps shrinking. Expect tools to move from hourly updates to near-instantaneous reporting as infrastructure improves.
Privacy-safe measurement. As privacy regulations tighten and third-party cookies disappear, reporting will rely more on first-party data and aggregated insights that protect individual customer privacy while still informing strategy.
Making Your Choice
Selecting the right Amazon Ads reporting tool comes down to matching capabilities with business needs.
Small sellers with basic campaigns and limited budgets often do fine with simple tools or even Amazon’s native reporting. The complexity of enterprise platforms would overwhelm rather than help.
Growing sellers spending thousands monthly benefit most from mid-tier platforms with profit analytics, automation, and solid support. This is where ROI from software really shines—better decisions quickly pay for monthly fees.
Enterprise brands managing massive spend across multiple markets need sophisticated platforms with API access, custom integrations, and white-glove support. At scale, even marginal efficiency improvements justify significant software investments.
Test before committing. Use free trials to evaluate whether a tool’s workflow matches how you think about advertising. Some platforms organize everything by campaign, others by product, others by keyword. Choose the structure that makes sense for your mental model.
Check if the tool actually solves your specific pain point. If manual bid adjustments consume hours daily, automation matters most. If profitability is murky, profit analytics take priority. If you’re drowning in search term data, search term analysis tools become critical.
Don’t over-buy. Features sound impressive in demos but if you’ll never use them, they’re just interface clutter. A simpler tool you actually use beats a sophisticated one you find confusing.
Frequently Asked Questions
The terms often overlap, but reporting tools focus primarily on data visualization and analysis while PPC management software typically includes bid automation and campaign creation features alongside reporting. Many modern platforms combine both—they pull reporting data and also make optimization changes automatically. Pure reporting tools show what happened; management software also tries to improve what happens next.
Yes, though it’s usually not necessary. Some sellers use one tool for automation and another for deep analytics. The main consideration is ensuring multiple tools don’t conflict when making bid changes—if two different automation platforms try adjusting the same keywords simultaneously, results become unpredictable. For reporting-only tools that don’t make changes, running several in parallel creates no technical issues, just added cost and complexity.
Most quality tools sync data at least daily, with many offering hourly updates. Amazon Marketing Stream provides near-real-time data but requires AWS setup. Standard Amazon Advertising API data typically has 24-48 hour delays for complete accuracy, though preliminary data appears faster. Tools can’t report data faster than Amazon makes it available through the API, so all third-party platforms work within those limitations.
Many tools support multiple Amazon marketplaces including US, UK, Germany, France, Italy, Spain, Canada, Japan, and others. Enterprise platforms typically handle all major marketplaces with unified reporting across regions. Budget-focused tools might limit support to the largest markets. Check specific marketplace support before subscribing if you sell internationally—not all tools support all Amazon marketplaces equally well.
True profit requires calculating net margin after all costs—product cost, Amazon fees, shipping, and ad spend. Look for tools that track profit per unit sold and TACOS rather than just ACOS. Lifetime customer value matters for subscription products or brands with high repeat purchase rates. Some advanced tools calculate incremental profit by comparing ad-attributed sales to organic baseline sales, showing true incremental value from advertising rather than sales that would have happened anyway.
The best tools correlate advertising spend with organic rank changes. When you push advertising for specific keywords, organic ranking for those terms often improves due to increased sales velocity. Tools that track both paid and organic keyword rankings help identify this relationship. Some platforms also pull data from Amazon Brand Analytics and Search Query Performance to show organic search volume and click-share alongside paid performance.
Calculate the value of time saved and performance improvements. If a tool saves five hours of manual reporting weekly, that’s 20+ hours monthly. Value that time at your effective hourly rate. Then estimate performance improvements—if better reporting helps you cut wasted spend by 10% on a $10,000 monthly budget, that’s $1,000 saved monthly. Compare these benefits to the tool’s cost. Most sellers find that proper reporting tools pay for themselves many times over once ad spend exceeds a few thousand monthly.
Conclusion
Amazon Ads reporting transforms from a painful chore into strategic advantage when the right tools handle the heavy lifting. Raw data becomes actionable insights. Hours of manual work compress into minutes of dashboard review.
The reporting landscape offers options for every business stage and budget. Amazon’s native solutions provide powerful capabilities for those with technical resources to implement them. Third-party platforms deliver user-friendly interfaces and profit-focused analytics that most sellers need.
The best tool isn’t the one with the most features. It’s the one that answers your specific questions clearly and helps you make better decisions faster. What’s killing profitability? Which campaigns deserve more budget? Where are the quick wins hiding in search term data?
Start by clarifying what you actually need to know. Then find the tool that surfaces those specific insights without burying them in complexity. Test before buying. Use free trials to ensure the interface matches your thinking.
Remember that reporting tools enable better decisions but don’t make decisions for you. Software shows where to look. Strategic judgment determines what to do next. The combination of quality reporting and thoughtful strategy is what actually moves campaign performance.
Ready to level up your Amazon advertising analytics? Pick one tool from this guide that matches your business stage, start a free trial, and spend a week using it daily. The insights you gain will either validate your current approach or reveal optimization opportunities you’ve been missing. Either way, better data beats guesswork every time.