
Quick Summary: Facebook Ads analytics tools help marketers track performance, optimize campaigns, and measure ROI beyond Meta’s native Ads Manager. Top platforms include Extuitive for Ad Prediction, Improvado for unified data warehousing, Whatagraph for client reporting, Segwise for creative intelligence, and Sprout Social for cross-channel analytics, each offering specialized features like attribution modeling, automated dashboards, and AI-powered insights to solve post-iOS 14 tracking challenges.
Meta Ads Manager shows campaign spend and conversions. But it doesn’t tell creative teams which visual hooks drive installs, or why Tuesday’s ad set suddenly crashed after three profitable days.
That gap between surface metrics and actionable intelligence is why performance marketers now rely on specialized Facebook Ads analytics tools. The native platform covers basics—reach, clicks, CPM—yet it can’t aggregate cross-channel attribution, benchmark creative elements at scale, or predict which audiences will fatigue before budget runs dry.
Apple’s App Tracking Transparency framework made this worse. Post-iOS 14, conversion windows shortened and attribution became probabilistic. Brands spending $50k+/month on Meta can’t afford guesswork. They need platforms that stitch together fragmented data, surface creative patterns, and deliver alerts before performance tanks.
This guide walks through the leading Facebook Ads analytics platforms for 2026. Each tool solves different pain points—data consolidation, white-label reporting, creative analysis, or audience insights. Some excel at agency workflows; others integrate directly into data warehouses for technical teams.
Here’s what matters when evaluating these platforms: accurate attribution models, creative-level breakdowns, automated anomaly detection, and cross-channel views that show how Facebook fits into the broader marketing stack.
Why Native Facebook Analytics Fall Short
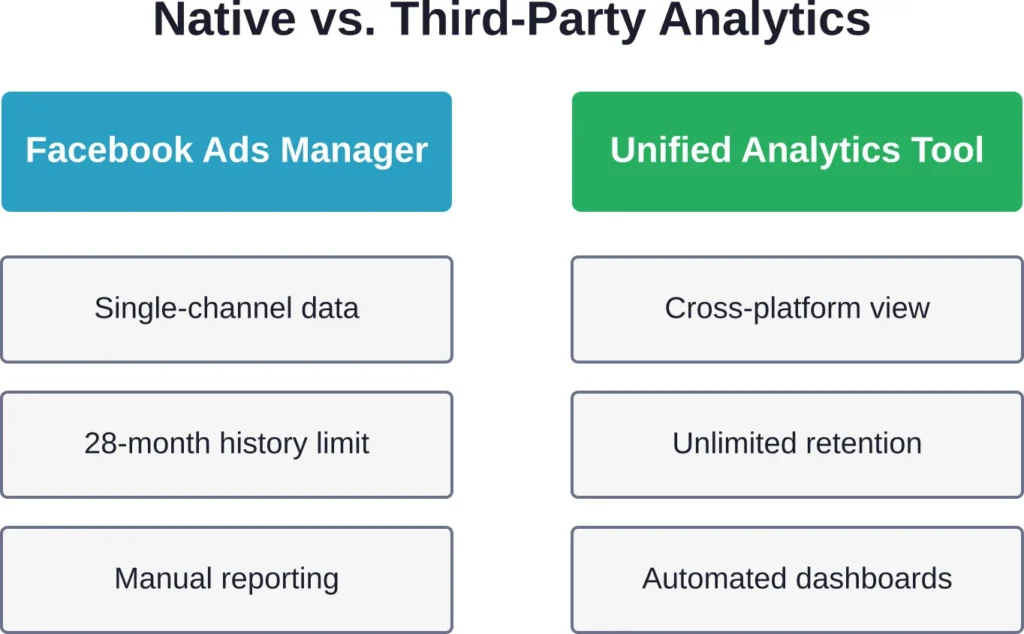
Meta Business Suite and Ads Manager are free and built into the platform. So why do performance teams pay hundreds per month for third-party tools?
The native interface tracks campaign-level performance well enough. Marketers can see spend, impressions, link clicks, and conversions broken down by ad set. But three critical limitations push teams toward specialized software.
Limited Historical Data and Export Constraints
Ads Manager stores granular data for roughly 28 months. After that, older breakdowns disappear. Teams running long-term brand campaigns lose year-over-year comparisons.
Export functionality exists, but it’s manual. Downloading reports for 50+ campaigns across multiple ad accounts takes hours. Spreadsheets pile up. Data gets stale before analysts finish formatting it.
No Cross-Channel Attribution
Facebook reports Facebook conversions. Google Ads reports Google conversions. If a user clicks a Facebook ad, then later converts via a Google search, Ads Manager credits the conversion to Facebook—but Google Ads also claims credit.
This double-counting inflates reported ROI. Native tools can’t deduplicate or model true customer journeys across platforms. Multi-touch attribution requires third-party analytics that ingest data from all channels and apply unified logic.
Shallow Creative Insights
Ads Manager shows which ad delivered 3.2% CTR and which got 1.8%. It doesn’t explain why. Did the winning creative use a specific color palette, testimonial format, or call-to-action placement?
For teams shipping 50+ unique creative variations monthly, manual analysis is impossible. Creative intelligence platforms tag elements automatically—parsing copy length, visual composition, offer type—and surface patterns that human reviewers miss.
Top Facebook Ads Analytics Tools for 2026
The platforms below represent the strongest options across different use cases. Some specialize in reporting, others in attribution or creative intelligence. Match the tool to the team’s primary pain point.
Extuitive: AI-Powered Pre-Launch Ad Prediction
Extuitive is an AI-driven predictive analytics platform specifically built for Meta and Facebook Ads. Instead of traditional post-campaign reporting, it uses advanced AI to forecast ad performance before launching, allowing advertisers to test and optimize creatives, audiences, and messaging in a virtual environment.
The platform simulates thousands of consumer reactions using AI agents and historical data to predict CTR, ROAS, CPA, and other key metrics with high accuracy. This makes it especially valuable for reducing wasted ad spend on unprofitable tests.
Best for: DTC brands, Shopify merchants, and performance marketers who want to minimize testing costs and maximize ROAS through pre-launch intelligence rather than relying solely on live campaign data.
Key features:
- AI consumer agents (150k+ simulations) that test ads before launch
- Predictive modeling for CTR, ROAS, conversions, and revenue
- Creative intelligence — analyzes visuals, copy, and hooks
- Seamless integration with Meta Ads, Shopify, and major ad accounts
- Pre-launch scoring and optimization recommendations
- Real-time performance forecasting during campaigns
Limitations: Focused primarily on Meta ecosystem (less multi-channel depth than unified platforms). Still a relatively new tool, so long-term enterprise track record is limited. Pricing is custom and best suited for mid-to-high budget advertisers.
Contact Information:
- Website: extuitive.com
- Email: [email protected]
- LinkedIn: www.linkedin.com/company/extuitive
- Twitter: x.com/Extuitive_Inc
- Instagram: www.instagram.com/extuitiveinc
Improvado: Unified Data Warehousing for Enterprise Teams

Improvado positions itself as a marketing data platform rather than a simple Facebook analytics tool. It ingests data from 500+ sources—Meta, Google, TikTok, CRM systems, email platforms—and loads everything into a data warehouse or business intelligence tool.
This approach works best for enterprise performance teams with technical resources. Instead of analyzing data inside Improvado’s interface, teams query the warehouse using SQL or connect it to Tableau, Looker, or Power BI.
Best for: Enterprise marketers with data engineering support who need cross-channel attribution and custom analytics.
Key features:
- 500+ pre-built connectors including Facebook, Instagram, Google Ads, TikTok, Snapchat
- Automated data transformation and schema mapping
- Direct loading into Snowflake, BigQuery, Redshift, or BI tools
- Custom attribution modeling across all channels
- Dedicated support and managed pipeline setup
Limitations: No native visualization layer. Teams must build dashboards in separate BI tools. Pricing is custom and typically suited to mid-market and enterprise budgets.
Whatagraph: White-Label Reporting for Agencies
Whatagraph focuses on automated client reporting. Agencies connect data sources, build dashboards with a drag-and-drop editor, and schedule reports to send automatically. The platform emphasizes visual presentation over deep analysis.
According to diggrowth.com (Feb 28, 2026), Whatagraph starts around $249/month with a 4.5/5 G2 rating (267 reviews). Gitnux.org rankings assign it an 8.1/10 overall score, reflecting strong usability but less depth than platforms built for technical users.
Best for: Agencies managing multiple client accounts who need beautiful, automated reports without technical complexity.
Key features:
- Drag-and-drop report builder with pre-made templates
- Cross-channel analytics combining Facebook, Google, and other platforms
- Automated report scheduling via email or shared links
- White-label branding with custom logos and colors
- Client portal for self-service access to live dashboards
Limitations: More focused on reporting than deep analysis. Limited custom attribution models. Pricing can escalate quickly for agencies managing many clients.
Segwise: Creative Intelligence for User Acquisition Teams

Segwise addresses a specific gap: understanding which creative elements drive performance. The platform automatically tags ad creatives—video hooks, color palettes, copy length, offer types—then correlates those tags with conversion data.
According to Segwise data from January 14, 2026, UA managers using the platform receive alerts before high-spending creatives tank performance and report significant time savings. The platform automatically generates performance reports by tag, and according to segwise.ai (Jan 14, 2026), helps UA managers produce data-backed creative iterations while reducing time spent on manual analysis.
The platform targets teams spending $50k+/month on Meta who produce 50+ unique creative variations monthly. For smaller advertisers, the feature set exceeds immediate needs and pricing reflects enterprise positioning.
Best for: User acquisition managers and creative teams at high-spend brands who need to scale winning creative patterns.
Key features:
- Automatic creative element tagging and pattern recognition
- Performance correlation showing which visual and copy elements drive conversions
- AI-powered creative generation based on winning patterns
- Real-time alerts when high-spending creatives underperform
- Creative fatigue prediction before performance degrades
Limitations: Requires significant ad spend to generate meaningful creative insights. Pricing not publicly listed; positioned for mid-market and enterprise budgets.
Sprout Social: Cross-Channel Management with Social Analytics

Sprout Social combines social media management with analytics. Teams schedule posts, monitor engagement, and track paid campaign performance in one interface. The platform covers organic and paid activity across Facebook, Instagram, Twitter, LinkedIn, and Pinterest.
Based on February 28, 2026 data from diggrowth.com, Sprout Social pricing starts at $249/user/month. Gitnux.org assigns it an 8.7/10 overall score, reflecting strong features and ease of use balanced against higher per-seat costs.
Best for: Social media teams managing both organic content and paid campaigns who want unified scheduling, monitoring, and analytics.
Key features:
- Unified inbox for social messages and comments across platforms
- Content calendar with team collaboration and approval workflows
- Paid and organic performance analytics
- Audience demographics and engagement insights
- Competitor benchmarking and share-of-voice tracking
Limitations: Per-user pricing gets expensive for larger teams. More suited to social management than deep advertising analytics. Advanced attribution and data warehouse integration are limited.
Hootsuite: Established Platform for Multi-Channel Social

Hootsuite is one of the oldest social media management platforms. It offers scheduling, monitoring, and basic analytics across major networks including Facebook, Instagram, Twitter, and LinkedIn.
According to diggrowth.com (Feb 28, 2026), Hootsuite pricing begins at $99/month. Gitnux.org rates it 8.4/10 overall. The platform’s strength lies in broad integrations and established workflows, though it lacks cutting-edge features found in newer tools.
Best for: Small to mid-sized teams needing affordable multi-channel scheduling and basic Facebook performance tracking.
Key features:
- Multi-account scheduling across major social platforms
- Basic analytics dashboards with engagement and reach metrics
- Team collaboration features and approval workflows
- Social listening and keyword monitoring
- Content calendar with bulk scheduling
Limitations: Analytics depth lags behind specialized platforms. Limited creative intelligence and attribution modeling. Interface feels dated compared to modern competitors.
Meta Business Suite: Native Free Option

Meta Business Suite is Facebook’s own management interface for Pages, Instagram accounts, and ad campaigns. It’s free and integrated directly into the Meta ecosystem.
According to gitnux.org, Meta Business Suite scores 9.4/10 overall. This score reflects its zero cost and direct integration, though limitations in cross-channel analytics and advanced reporting remain.
Best for: Small businesses and solo marketers who only advertise on Facebook and Instagram and don’t need advanced features.
Key features:
- Unified view of Facebook Page and Instagram account
- Basic post scheduling and publishing
- Inbox for messages and comments
- Performance insights for organic and paid content
- Ad creation and campaign management
Limitations: All the native analytics shortcomings discussed earlier apply. No cross-channel data, limited historical retention, shallow creative insights, and manual reporting workflows.
Agorapulse: Social Management with Robust Reporting

Agorapulse balances social media management features with stronger analytics than competitors. Teams get scheduling, monitoring, and detailed performance reports in one platform.
Gitnux.org assigns Agorapulse an 8.8/10 overall rating, reflecting its solid feature set and user-friendly interface. The platform suits small to mid-sized teams that want better analytics than basic tools without enterprise-level complexity.
Best for: Growing social teams that need more analytics depth than Hootsuite but less complexity than enterprise platforms.
Key features:
- Social inbox with assignment and collaboration tools
- Content calendar and bulk scheduling
- Detailed analytics with custom date ranges and comparisons
- Competitor tracking and benchmarking
- ROI tracking for paid campaigns
Limitations: Pricing scales up quickly as team size grows. Still primarily a social management tool rather than dedicated advertising analytics platform.
Databox: KPI Dashboards for Multiple Data Sources
Databox creates live dashboards that pull metrics from multiple sources including Facebook Ads and other platforms. Teams build custom KPI views and monitor performance in real time.
With an 8.1/10 overall rating from gitnux.org, Databox offers solid dashboard functionality at accessible pricing. It works well for teams that want centralized KPI monitoring without building custom BI infrastructure.
Best for: Marketing managers who need centralized KPI dashboards combining Facebook metrics with website analytics and CRM data.
Key features:
- Pre-built dashboard templates for common use cases
- Drag-and-drop dashboard builder
- Mobile app for on-the-go metric monitoring
- Goal tracking and performance alerts
- Data connector for 70+ marketing platforms
Limitations: Dashboard-focused rather than deep analytics. Limited data transformation capabilities. Not ideal for teams needing custom attribution models or complex analysis.
AgencyAnalytics: Client Reporting Platform for Marketing Agencies

AgencyAnalytics targets digital marketing agencies with automated client reporting across SEO, PPC, social media, and analytics platforms. The tool emphasizes white-label reports and client dashboards.
AgencyAnalytics is rated among top agency reporting platforms. The platform balances breadth of integrations with reporting automation, though it lacks the depth of specialized advertising analytics tools.
Best for: Full-service digital marketing agencies managing SEO, PPC, social media, and analytics for multiple clients.
Key features:
- White-label reports with custom branding
- Automated report scheduling and delivery
- Client dashboard portal for self-service access
- Integrations for 60+ marketing platforms
- Rank tracking for SEO alongside paid advertising metrics
Limitations: Broad coverage comes at the expense of depth in any single channel. Facebook-specific analytics are more basic than dedicated advertising platforms.
Socialinsider: Competitor Benchmarking and Historical Analysis

Socialinsider specializes in competitive analysis and historical data retention. Teams can benchmark their Facebook performance against competitors and analyze trends over three to four years depending on the plan.
According to competitor content, Socialinsider offers a 14-day free trial with monthly plans starting from $99. The platform’s strength is long-term historical analysis and competitor tracking rather than real-time optimization.
Best for: Brand managers and strategists who need competitive benchmarking and multi-year trend analysis.
Key features:
- Historical data retention up to 3-4 years depending on plan
- Competitor benchmarking across organic and paid metrics
- AI-powered insights and automation features
- Cross-platform analytics including Instagram, Twitter, LinkedIn
- Custom reporting with exportable data
Limitations: Less focused on real-time campaign optimization. Creative intelligence and attribution modeling are limited compared to specialized platforms.
Key Metrics Every Facebook Ads Analytics Tool Should Track
Regardless of which platform teams choose, certain metrics are non-negotiable. These KPIs reveal campaign health, guide optimization decisions, and justify budget allocation.
Return on Ad Spend (ROAS)
ROAS measures revenue generated per dollar spent on advertising. A campaign with $10,000 spend generating $40,000 in revenue has 4x ROAS.
This metric directly ties advertising to business outcomes. But calculating accurate ROAS requires proper attribution—crediting the right channel for conversions and avoiding double-counting.
Cost Per Acquisition (CPA)
CPA shows how much it costs to acquire one customer through Facebook Ads. If a campaign spends $5,000 and generates 100 purchases, CPA is $50.
Teams track CPA against customer lifetime value (LTV). When CPA exceeds LTV, campaigns lose money long-term despite showing positive ROAS in the short term.
Click-Through Rate (CTR)
CTR measures the percentage of people who see an ad and click it. High CTR indicates relevant targeting and compelling creative. Low CTR suggests messaging or audience mismatch.
But CTR alone doesn’t guarantee conversions. An ad might drive clicks from curious users who never purchase. Smart teams track CTR alongside conversion rate to identify quality traffic.
Conversion Rate
Conversion rate tracks the percentage of ad clicks that result in desired actions—purchases, sign-ups, downloads. A campaign with 1,000 clicks and 50 purchases has a 5% conversion rate.
Low conversion rates with high CTR point to landing page problems or targeting misalignment. The ad attracts clicks, but the offer or page experience doesn’t match user expectations.
Cost Per Thousand Impressions (CPM)
CPM shows how much advertisers pay for 1,000 ad impressions. This metric reflects auction competitiveness. High CPM indicates either strong competition for target audiences or poor ad relevance scores.
Meta’s algorithm rewards relevant ads with lower CPM. When Facebook’s system determines an ad provides value to users, it charges less to display that ad.
Frequency
Frequency measures how many times the average user sees an ad. New campaigns typically show low frequency. As campaigns run, frequency increases.
High frequency (above 5-7) often signals audience fatigue. Performance metrics degrade as users see the same creative repeatedly. Creative refresh becomes necessary.
Creative Fatigue Indicators
Beyond frequency, advanced analytics platforms track CTR decline, engagement rate drops, and CPM increases—all signals that creatives are fatiguing. Platforms like Segwise predict fatigue before it impacts spend, letting teams replace creatives proactively.
| Metric | What It Measures | Optimization Signal |
|---|---|---|
| ROAS | Revenue per ad dollar | Low ROAS → adjust targeting, creative, or offers |
| CPA | Cost to acquire one customer | CPA above target → optimize funnel or pause campaign |
| CTR | Click rate on impressions | Low CTR → test new creative or refine audience |
| Conversion Rate | Purchases per click | Low rate → fix landing page or targeting mismatch |
| CPM | Cost per 1000 impressions | High CPM → improve relevance score or expand audience |
| Frequency | Avg impressions per user | Frequency above 7 → refresh creative to prevent fatigue |
Advanced Analytics Features That Separate Premium Tools
Basic platforms track standard metrics. Premium tools offer capabilities that transform how teams optimize campaigns.
Predictive Analytics and AI Insights
Machine learning models analyze historical performance and predict future outcomes. These systems identify patterns humans miss—subtle correlations between audience segments, creative elements, and conversion rates.
Platforms with AI-powered insights recommend optimization actions automatically. Instead of manually reviewing dozens of campaigns, performance marketers receive prioritized suggestions: “Increase budget on Campaign X by 30%” or “Pause Ad Set Y due to rising CPA.”
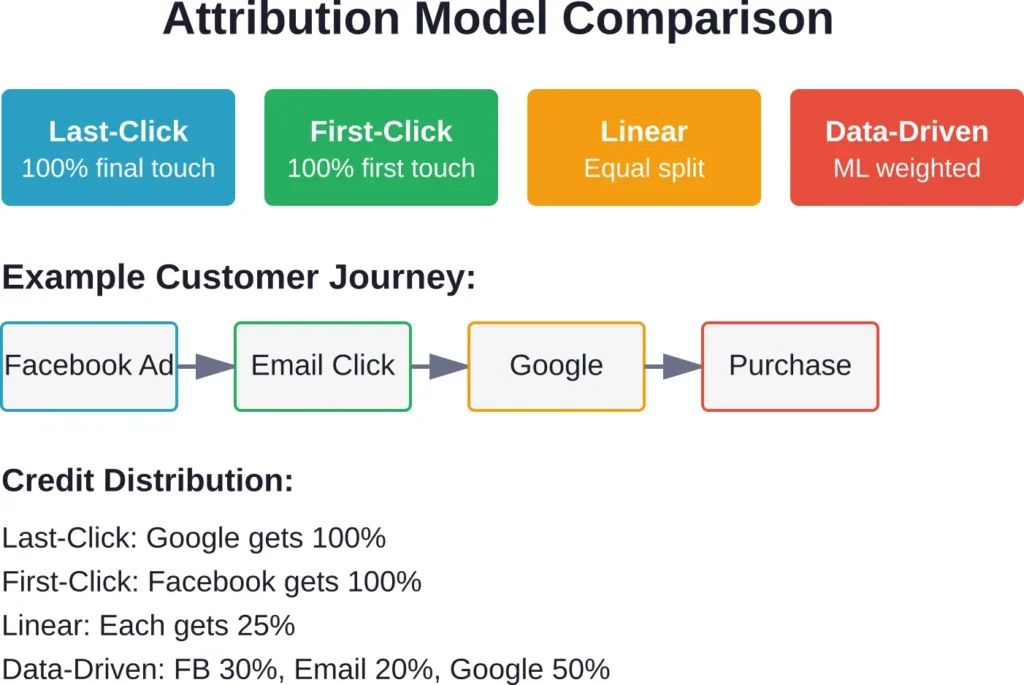
Multi-Touch Attribution Modeling
Single-touch attribution awards 100% credit to one touchpoint—usually the last click. This oversimplifies customer journeys.
Multi-touch attribution distributes credit across all touchpoints. Linear models split credit evenly; time-decay models give more weight to recent interactions; data-driven models use machine learning to assign credit based on conversion probability.
Proper attribution reveals which channels assist conversions versus which close deals. Facebook Ads might drive initial awareness while Google search converts buyers days later. Without multi-touch modeling, teams undervalue the awareness role.
Automated Anomaly Detection
Performance data fluctuates. Spending an hour each morning checking if yesterday’s numbers are normal wastes time.
Anomaly detection algorithms flag unusual changes automatically. When CTR drops 40% overnight or CPA spikes beyond historical ranges, the system alerts managers immediately.
This speeds response time. Teams catch problems within hours instead of days, reducing wasted spend on underperforming campaigns.
Creative Element Tagging and Pattern Recognition
Manual creative analysis doesn’t scale. Reviewing 50 ad variations weekly to identify winning elements takes hours.
Creative intelligence platforms tag elements automatically—colors, text length, visual composition, call-to-action phrasing. The system correlates those tags with performance, surfacing patterns like “testimonial-style videos generate 35% higher conversion rates” or “blue color schemes outperform red by 18%.”
This data-driven creative approach lets teams produce winning variations faster. According to segwise.ai (Jan 14, 2026), brands using creative intelligence reduce production time by 50% while increasing creative output to 10+ data-backed iterations.
Incrementality Testing and Lift Measurement
Correlation doesn’t prove causation. Just because conversions increased during a Facebook campaign doesn’t mean the ads caused those conversions. Maybe an email promotion ran simultaneously, or seasonal demand spiked.
Incrementality testing uses holdout groups—audiences deliberately excluded from ads—to measure true lift. By comparing conversion rates between exposed and unexposed groups, teams calculate how many conversions Facebook truly drove versus what would have happened anyway.
Few platforms offer built-in incrementality testing. Those that do provide the most accurate measure of advertising effectiveness.
Common Challenges and How Tools Solve Them
Even the best analytics platforms face limitations imposed by API restrictions, privacy regulations, and platform changes. Understanding these challenges helps set realistic expectations.
iOS 14+ Attribution Loss
Apple’s App Tracking Transparency framework requires explicit user permission for cross-app tracking. Most users opt out. This disrupted Facebook’s conversion tracking, especially for mobile app advertisers.
Analytics tools can’t restore lost data, but they compensate through modeling. Platforms aggregate anonymized data patterns, statistical modeling, and first-party data integration to estimate true performance more accurately than native Facebook reporting alone.
API Rate Limits and Data Delays
Facebook’s Marketing API imposes rate limits on data requests. Tools syncing data for hundreds of ad accounts can hit these limits, causing delays or incomplete data pulls.
Reliable platforms manage rate limits intelligently—queuing requests, retrying failures, and alerting users when data freshness lags. Check uptime records and error-handling documentation before choosing a provider.
Creative Analysis at Scale
Manually reviewing 50+ creative variations weekly is impractical. Teams need automated tagging and pattern recognition.
Creative intelligence platforms solve this by automatically parsing ad assets, tagging elements, and correlating tags with performance. This turns creative analysis from a weekly manual task into a continuous automated process.
Cross-Channel Deduplication
When users interact with Facebook ads, Google ads, and email campaigns before converting, each platform claims the conversion. Total reported conversions exceed actual sales.
Unified analytics platforms deduplicate by matching conversion events across channels using timestamps and user identifiers. This produces accurate channel contribution data rather than inflated self-reported numbers.
Historical Data Retention
Native Facebook tools limit historical data access. As campaigns age, detailed breakdowns disappear.
Third-party platforms solve this by storing historical data independently. Once a tool ingests data, it persists regardless of Facebook’s retention policies. Platforms like Socialinsider and Improvado retain years of granular campaign data for long-term trend analysis.
Integration Capabilities That Extend Analytics Value
Analytics tools deliver maximum value when they connect to the broader marketing stack. Key integrations include:
Business Intelligence and Data Warehouses
Technical teams often want advertising data in their existing BI tools—Tableau, Looker, Power BI—or data warehouses like Snowflake and BigQuery.
Platforms like Improvado specialize in these integrations, acting as data pipelines rather than standalone analytics interfaces. This approach works best for teams with data engineering resources.
CRM Systems
Connecting Facebook Ads data to CRM platforms like Salesforce or HubSpot links advertising spend to customer lifetime value. Teams can track which campaigns generate high-LTV customers versus one-time buyers.
This closed-loop reporting justifies advertising investment by showing long-term customer value, not just immediate ROAS.
Email Marketing Platforms
Integrating email tools like Mailchimp or Klaviyo shows how Facebook ads and email campaigns work together. Did Facebook drive initial sign-ups that email nurture sequences converted?
Cross-channel attribution requires these integrations to accurately credit each marketing touchpoint.
E-commerce Platforms
Direct connections to Shopify, WooCommerce, or Magento enable product-level analysis. Which products drive the highest ROAS? Which audience segments prefer specific product categories?
This granularity transforms advertising strategy from campaign-level to product-level optimization.
Pricing Models and What to Expect
Facebook analytics tools follow several pricing structures. Understanding these models helps budget appropriately.
Per-User Subscription
Tools like Sprout Social charge per user seat. At $249/user/month based on February 28, 2026 data from diggrowth.com, costs scale linearly with team size.
This model works well for small teams but becomes expensive as organizations grow. A 10-person team pays $2,490 monthly.
Flat-Rate Plans
Platforms like Whatagraph and Hootsuite offer flat monthly rates regardless of user count. Whatagraph starts at $249/month and Hootsuite at $99/month according to February 28, 2026 diggrowth.com data.
These plans typically tier based on features, data volume, or number of connected accounts rather than seats. This benefits larger teams sharing access.
Custom Enterprise Pricing
Enterprise platforms like Improvado and Segwise don’t publish pricing. They quote based on ad spend, data volume, and required features.
This model targets high-spend advertisers. Platforms position these solutions for brands spending $50k+/month on Meta according to Segwise criteria from January 14, 2026 data.
Free Tiers and Trials
Meta Business Suite is completely free. Other platforms offer free trials—Socialinsider provides 14 days according to competitor content.
Free tiers typically limit features, data retention, or number of connected accounts. They work for evaluation but rarely meet production needs at scale.
| Platform | Pricing Model | Starting Price | Best For |
|---|---|---|---|
| Meta Business Suite | Free | $0 | Solo marketers, basic needs |
| Hootsuite | Flat monthly | $99/month | Small teams, multi-channel |
| Whatagraph | Flat monthly | $249/month | Agencies, client reporting |
| Sprout Social | Per user | $249/user/month | Social teams, collaboration |
| Improvado | Custom enterprise | Contact sales | Enterprise, data warehouse |
| Segwise | Custom enterprise | Contact sales | High-spend UA, creative intel |
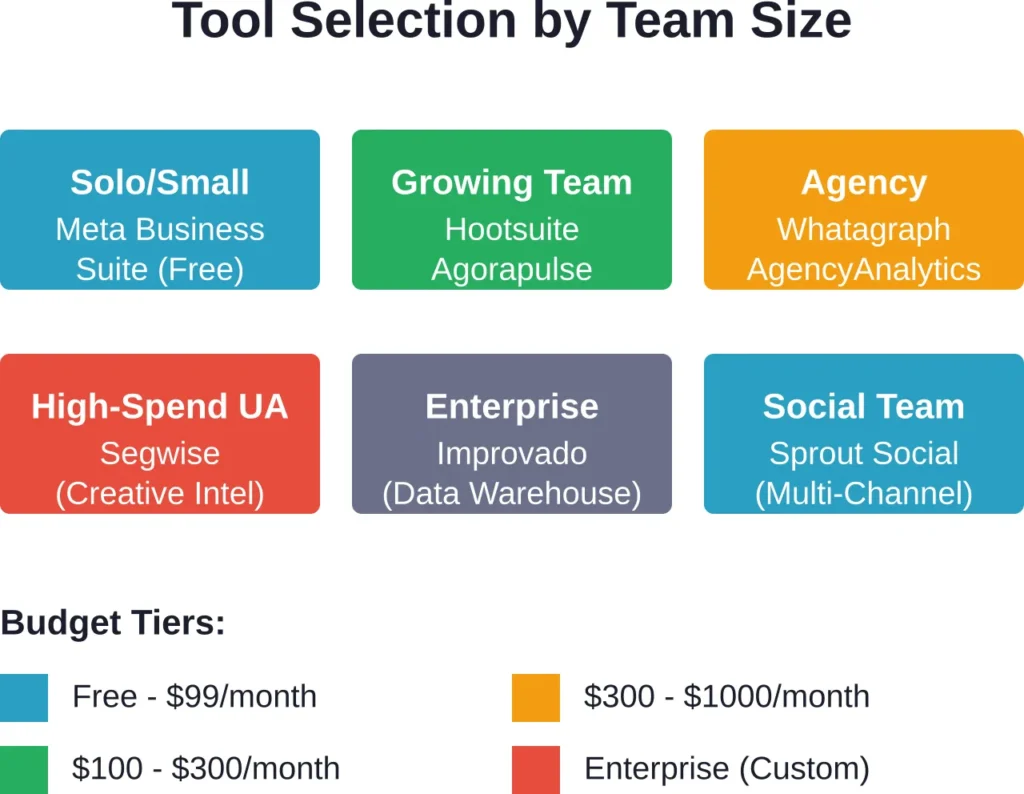
How to Choose the Right Tool for Your Team
With dozens of platforms available, selection requires matching capabilities to actual needs. Start with these decision criteria.
Define Primary Use Case
What problem needs solving? Agency client reporting requires different features than in-house creative optimization.
Agencies prioritize white-label reporting and multi-client management. Performance marketers need deep attribution and creative intelligence. Social media managers want scheduling alongside analytics.
Assess Technical Resources
Does the team have data engineering support? Platforms like Improvado require technical setup—configuring data warehouse connections, building BI dashboards, managing pipelines.
Teams without engineering resources should choose platforms with built-in visualization and simpler setup like Whatagraph or Agorapulse.
Evaluate Current Ad Spend
Brands spending under $10,000 monthly on Facebook likely don’t need enterprise platforms. Native tools plus basic reporting software often suffice.
Once monthly spend exceeds $50,000, the cost of wasted budget from poor optimization far exceeds tool subscription fees. Advanced analytics pays for itself through improved performance.
Check Integration Requirements
List every platform in the current marketing stack—Google Ads, email tools, CRM, analytics platforms, e-commerce systems. Verify the analytics tool connects to all critical sources.
Missing integrations force manual data exports and spreadsheet reconciliation, eliminating automation benefits.
Test Before Committing
Most platforms offer free trials. Use them. Connect real accounts, build representative dashboards, and run reports that match actual workflows.
Sales demos show ideal scenarios. Trials reveal whether the platform handles real data complexity—multiple time zones, various currency formats, complex account structures.
Consider Total Cost of Ownership
Subscription fees are obvious, but implementation time and training costs matter too. Enterprise platforms may require weeks of setup plus ongoing maintenance.
Simpler tools cost less upfront but may lack features that become critical as campaigns scale. Balance immediate budget constraints against future needs.
Future Trends in Facebook Ads Analytics
The analytics landscape evolves as platforms add features, privacy regulations tighten, and AI capabilities advance. Several trends are shaping the next generation of tools.
Increased Reliance on First-Party Data
Third-party cookies are disappearing. Browser tracking restrictions increase. Analytics platforms compensate by emphasizing first-party data—information brands collect directly from customers.
Tools increasingly integrate with customer data platforms (CDPs) and CRM systems to leverage owned data for attribution and audience insights rather than relying on platform pixels alone.
AI-Driven Optimization Recommendations
Machine learning models now suggest specific actions: “Increase Budget X by 25%” or “Pause Ad Set Y immediately.” These recommendations rely on algorithms detecting patterns across thousands of campaigns.
As models improve, platforms move from passive reporting toward active optimization—automatically adjusting bids, budgets, and targeting based on performance patterns.
Creative Intelligence Becoming Standard
What began as a specialized feature in platforms like Segwise is becoming table stakes. More tools add automated creative tagging and element-level performance analysis.
This reflects the reality that creative quality now matters more than targeting precision post-iOS 14. When audience targeting becomes less precise, ad creative must work harder to drive conversions.
Incrementality Testing for True Measurement
Marketers increasingly question whether reported conversions represent true lift or would have happened anyway. Incrementality testing—comparing exposed versus unexposed audiences—provides answers.
More platforms are building incrementality features, though these remain complex to implement correctly. Expect wider availability as testing methodologies mature.
Privacy-Preserving Analytics Methods
Regulations like GDPR and CCPA restrict data collection and tracking. Analytics platforms must deliver insights while respecting user privacy.
Techniques like aggregated reporting, differential privacy, and modeled conversions allow performance tracking without individual user surveillance. These methods will become standard as privacy laws expand globally.
Frequently Asked Questions
Facebook Ads Manager provides native reporting for Meta campaigns with basic metrics like spend, impressions, and conversions. Third-party tools add cross-channel attribution, historical data retention beyond 28 months, automated reporting, creative element analysis, and integration with other marketing platforms. They solve attribution gaps, especially post-iOS 14, and enable deeper analysis than native tools allow.
Pricing varies widely based on features and team size. Basic tools start around $99/month (Hootsuite), mid-tier platforms run $249/month (Whatagraph, Sprout Social per-user), and enterprise solutions require custom pricing typically suited for brands spending $50k+/month on ads. Meta Business Suite is free but limited. Budget 1-3% of monthly ad spend for analytics tools as a general guideline.
Analytics platforms can’t restore lost tracking data, but they mitigate attribution gaps through statistical modeling, aggregated data analysis, and first-party data integration. They provide more accurate attribution than native Facebook reporting alone by combining multiple data sources and applying advanced modeling. However, no tool fully solves the fundamental tracking limitations imposed by App Tracking Transparency.
Critical metrics include ROAS (return on ad spend), CPA (cost per acquisition), conversion rate, CTR (click-through rate), CPM (cost per thousand impressions), and frequency. ROAS and CPA directly tie to business outcomes. CTR and conversion rate reveal creative and targeting effectiveness. Frequency indicates audience fatigue. Track all these together rather than focusing on single metrics in isolation.
Many platforms like Sprout Social and Hootsuite handle both organic and paid social analytics in one interface. However, tools optimized for paid performance (like Segwise or Improvado) offer deeper advertising-specific features—attribution modeling, creative intelligence, cross-channel analysis. If organic social is a priority alongside paid campaigns, choose platforms explicitly designed for both rather than advertising-only tools.
Creative intelligence tools use computer vision and natural language processing to analyze ad assets. They detect visual elements (colors, faces, text placement), parse copy (length, keywords, questions), identify video features (hooks, pacing), and categorize offer types. The platform then correlates these tagged elements with performance data to surface patterns—like “testimonial-style videos generate 35% higher CTR”—that guide creative production.
Prioritize integrations based on your marketing stack. Essential connections typically include Facebook/Instagram, Google Ads (for cross-channel attribution), and your website analytics platform. Secondary integrations depend on business model: e-commerce brands need Shopify/WooCommerce; B2B companies need CRM integration (Salesforce, HubSpot); email-heavy strategies require Mailchimp/Klaviyo. Check that critical integrations exist before committing to a platform.
Conclusion
Facebook Ads Manager shows what happened. Quality analytics tools explain why it happened and what to do next.
The gap between these capabilities widens as advertising complexity increases. Brands spending significant budget on Meta need platforms that solve attribution challenges, surface creative patterns, predict performance shifts, and automate reporting workflows.
No single tool fits every situation. Agencies managing dozens of clients need different features than in-house performance teams optimizing user acquisition. Solo marketers running modest campaigns have different requirements than enterprises with data warehouses and engineering resources.
Start by clarifying the primary use case. What problem causes the most pain today—attribution gaps, manual reporting, creative fatigue, cross-channel confusion? Match that pain point to the tools strongest in that area.
For agency reporting, Whatagraph and AgencyAnalytics deliver automated white-label dashboards. For enterprise data consolidation, Improvado connects Facebook data to existing warehouses and BI tools. For creative optimization at scale, Segwise provides element-level intelligence that drives production decisions. For social teams managing organic and paid together, Sprout Social and Agorapulse balance scheduling with analytics.
Meta Business Suite remains viable for small advertisers with basic needs. But as ad spend grows past $10,000 monthly, the cost of suboptimal decisions from limited analytics far exceeds tool subscription fees. A 5% performance improvement from better insights pays for premium software many times over.
Take advantage of free trials. Connect real accounts and run actual workflows during evaluation periods. Sales demos show ideal scenarios; trials reveal whether platforms handle real complexity.
The Facebook advertising landscape keeps shifting—attribution rules change, creative fatigue accelerates, privacy regulations expand. Analytics tools that adapt to these changes protect advertising investments and maintain competitive advantage as platforms evolve.
Ready to upgrade your Facebook Ads analytics? Start by auditing current reporting gaps, then test the three platforms that best match your primary use case. Better insights drive better decisions, and better decisions drive better ROAS.