
Quick Summary: Amazon reporting tools fall into three main categories: native Amazon solutions (Seller Central, QuickSight, AWS Cost & Usage Reports), third-party seller analytics platforms (WisePPC, Jungle Scout, Helium 10, Sellerboard), and AWS cost management tools (nOps, CloudWatch, Cost Explorer). Each serves different needs—sellers need profit tracking and keyword data, while AWS users require cloud spend visibility and optimization.
Tracking Amazon data without the right tools is like flying blind. Whether selling products on the marketplace or running infrastructure on AWS, the difference between profit and loss often comes down to what you measure and how quickly you act on it.
But here’s the problem: Amazon’s ecosystem spans completely different worlds. Marketplace sellers need profit margins, keyword rankings, and inventory alerts. AWS users need cloud cost breakdowns, resource utilization, and budget forecasts. The term “Amazon reporting tools” covers both—and they share almost nothing in common.
This guide breaks down both categories. We’ll cover native Amazon solutions, third-party platforms, and specialized tools that fill the gaps Amazon leaves open.
Understanding Amazon’s Reporting Ecosystem
Amazon provides reporting capabilities across two distinct platforms. Seller Central serves marketplace sellers with sales, inventory, and advertising data. AWS Console serves cloud users with infrastructure metrics, billing reports, and service logs.
Neither platform talks to the other. A seller running ads on Amazon.com won’t find those metrics in AWS. An engineer monitoring EC2 instances won’t see marketplace data in CloudWatch.
Third-party tools exist because Amazon’s native reporting has gaps. Seller Central doesn’t calculate true profit after all fees. AWS Cost Explorer doesn’t predict future spend or optimize automatically. The market responded with specialized solutions.
Native vs. Third-Party: What’s the Difference?
Native tools come directly from Amazon. They’re free (or included with your account), always up-to-date with policy changes, and integrate seamlessly with other Amazon services. The downside? Limited customization and basic analytics.
Third-party tools cost money but add layers Amazon doesn’t provide. Real-time profit tracking. Competitor monitoring. Automated alerts. Predictive analytics. They pull data from Amazon’s APIs and transform it into actionable insights.
Most successful operations use both. Native tools for raw data and compliance. Third-party platforms for decisions and optimization.
Amazon Seller Reporting Tools
Marketplace sellers face a specific challenge: Amazon provides sales data but hides the full picture. You can see revenue, but calculating actual profit requires tracking referral fees, FBA fees, storage costs, advertising spend, and returns.
That’s where seller-focused reporting tools come in. They connect to your Seller Central account, pull transaction data, and calculate metrics Amazon won’t show you.
WisePPC: Amazon PPC Analytics & Optimization
WisePPC is a specialized tool focused on deep Amazon PPC analysis and optimization (Sponsored Products, Sponsored Brands, Sponsored Display). It combines advertising data with sales performance, providing years of historical data — far beyond the 60–90 days limit in Seller Central — and helps sellers understand the real impact of ads on overall revenue and profitability.
As an official Amazon Ads Verified Partner, it pulls data directly through Amazon’s API. The platform supports multi-account management, hourly granularity, bulk editing (up to 10K+ changes at once), 30+ key metrics (ACoS, ROAS, TACoS, CTR, ASP, etc.), color-coded alerts, and advanced visualization.
Pricing: Freemium model. Free plan available for basic use. Paid plans start around $126/month (usage-based). Frequent promotions include a free month and lifetime discounts for early users.
Best use case: Ideal for mid-to-large Amazon sellers who run significant ad spend and need clear visibility into which campaigns actually drive profit — not just revenue. Excellent for long-term trend analysis, quick segmentation by placement, match type, or bid strategy, and making data-driven bulk adjustments without manual hassle.
WisePPC shines at bridging the gap between advertising and organic sales. It shows how PPC affects organic performance and helps sellers move from guesswork to confident, long-term decision-making.
Contact Information:
- Website: wiseppc.com
- Facebook: www.facebook.com/people/Wise-PPC/61573154427547
- LinkedIn: www.linkedin.com/company/wiseppc
- Instagram: www.instagram.com/wiseppc
Seller Central Native Reports

Every seller gets access to Seller Central’s built-in reporting suite. The Business Reports section shows sales, traffic, and conversion data. The Payments section shows transaction history. The Advertising Console shows campaign performance.
According to the official Amazon Seller Central documentation, sellers can automate report generation through the Selling Partner API v2021-06-30, which operates across three regions: NA (North America), EU (Europe), and FE (Far East). The API supports 15 different analytics report types including brand analytics and traffic reports.
These reports are 100% first-party accurate and come directly from Amazon at no extra cost. The data updates daily, and you can export to Excel for custom analysis.
The limitation? No profit calculation. Seller Central shows gross sales, not net profit. You see advertising spend but not ACOS relative to actual profit margins. For basic tracking, it works. For real financial decisions, you need more.
Jungle Scout: Product Research and Market Intelligence

Jungle Scout started as a product research tool but evolved into a comprehensive analytics platform. It tracks sales estimates, keyword rankings, competitor products, and market trends.
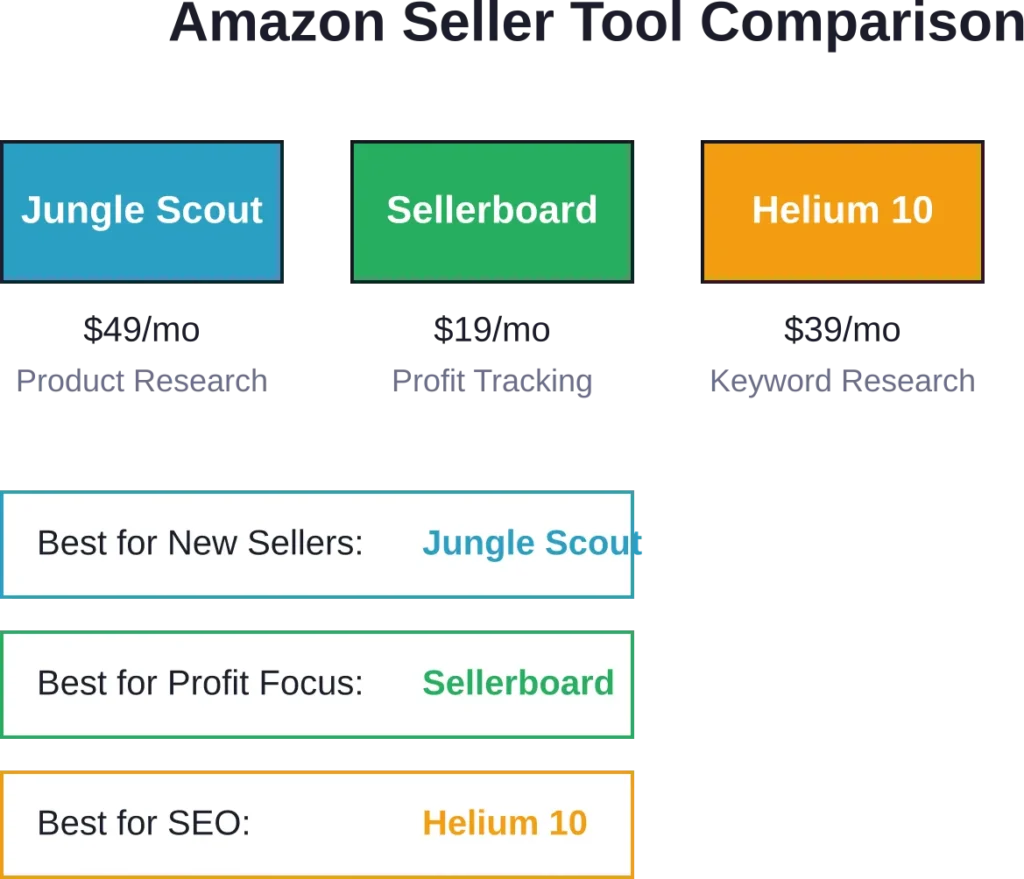
Pricing starts at $49 per month for the basic plan. The platform combines Amazon data with proprietary algorithms to estimate competitor sales volumes—something Amazon doesn’t share publicly.
Strongest use case: finding new products to sell. The market intelligence features show which niches have demand but limited competition. For established sellers, the keyword tracker and inventory manager add ongoing value.
Sellerboard: Real-Time Profit Tracking

Sellerboard focuses on one thing: showing you actual profit in real-time at the SKU level. It calculates every Amazon fee, advertising cost, promotion discount, and return to show true margins.
Pricing starts at $19 per month with a free one-month trial. The dashboard updates continuously, so you know your profit position at any moment—not just at month-end when you reconcile spreadsheets.
The profit tracking accuracy depends on proper setup. You need to input product costs, shipping fees, and any off-Amazon expenses. Once configured, Sellerboard handles the rest automatically.
Best for sellers who need financial clarity fast. If you’re running paid ads and need to know which campaigns actually generate profit (not just revenue), Sellerboard answers that question immediately.
Helium 10: Keyword Research and Listing Optimization

Helium 10 bundles 20+ tools for Amazon sellers. The core value sits in keyword research and listing optimization. Cerebro reverse-engineers competitor keywords. Magnet discovers new keyword opportunities. Frankenstein processes keyword lists at scale.
The free plan offers limited daily searches. Paid plans start at $39 per month for individual sellers. The platform targets sellers who compete on search visibility—if customers can’t find your listing, nothing else matters.
Deepest Amazon keyword database on the market. The chrome extension provides on-page analysis while browsing any Amazon listing. For SEO-focused sellers, Helium 10 pays for itself quickly.
SmartScout: Brand and Category Analytics

SmartScout maps the entire Amazon marketplace by brand, category, and seller. It estimates brand revenue, tracks product launches, and identifies wholesale opportunities.
Pricing starts at $29 per month with a seven-day free trial. The platform appeals to sellers evaluating new categories or researching acquisition targets.
The brand mapping feature shows which companies dominate specific niches and how much revenue they likely generate. For strategic planning, this macro view complements the SKU-level data from other tools.
Amazon Business Reports for B2B Sellers
Amazon Business operates as a separate marketplace layer with different buyer behavior and reporting needs. Business buyers purchase in bulk, negotiate pricing, and evaluate suppliers differently than retail customers.
According to official Amazon documentation (published August 5, 2025), the B2B Central dashboard provides sales snapshots and performance summaries by customer segment. These reports help sellers understand business pricing effectiveness and identify which discount tiers drive volume.
The reports track order metrics, traffic metrics, conversion metrics, Featured Offer metrics, and business pricing metrics. This granular B2B data doesn’t appear in standard Seller Central reports.
For sellers targeting business customers, these reports answer critical questions: Which industries buy your products? Do quantity discounts increase order size enough to offset margin compression? Are business buyers more or less price-sensitive than retail customers?
The Fee Discounts Report specifically tracks referral fee savings from Amazon Business. The report shows current price, referral fee at current price, target price, fee at target price, discount amount, discount type, and discount duration.
AWS Cost and Usage Reporting Tools
AWS billing complexity grows with usage. A simple account might have two services. An enterprise account might have 50 services across 10 regions with reserved instances, savings plans, spot instances, and data transfer charges.
Without proper reporting, AWS costs spiral. Resources run idle. Dev environments stay online over weekends. Storage accumulates. The bill arrives, and nobody knows which project drove the increase.
AWS provides native cost reporting tools. Third-party platforms add optimization and automation.
AWS Cost Explorer: Native Cost Analysis

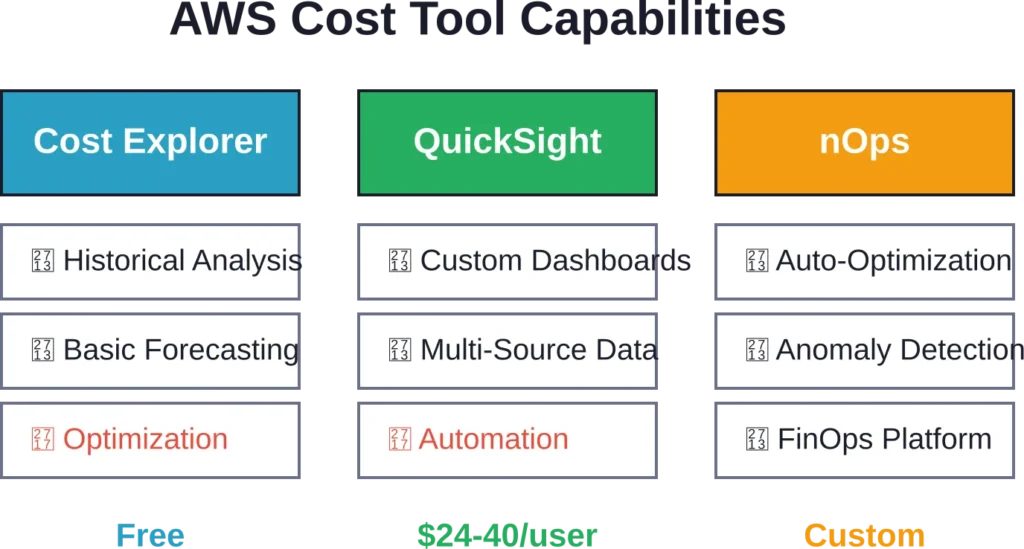
Cost Explorer ships free with every AWS account. It visualizes spend by service, region, tag, or custom dimension. The interface lets you filter by time period, group by different attributes, and forecast future costs based on historical trends.
Basic cost tracking works well here. You can see that EC2 consumed $5,000 last month or that us-east-1 costs more than eu-west-1. For small teams with simple infrastructure, Cost Explorer provides enough visibility.
The limitation? Cost Explorer shows you what happened, not what to do about it. It doesn’t identify waste, recommend rightsizing, or optimize automatically. You get data, not decisions.
AWS Cost & Usage Reports: Detailed Billing Data

Cost & Usage Reports (CUR) deliver the complete billing dataset Amazon generates, exporting to S3 as CSV files for analysis. The reports include resource IDs, tags, pricing details, and usage quantities, enabling integration with QuickSight and third-party analytics tools for custom analysis.
Technical teams use CUR to build custom dashboards, allocate costs to specific projects, or feed data into financial systems. The raw data format requires technical skill to parse, but the flexibility beats Cost Explorer’s pre-built views.
Amazon QuickSight: Business Intelligence for AWS Data

QuickSight is Amazon’s cloud BI platform. It connects to AWS data sources (including CUR files) and builds interactive dashboards with drill-down capabilities.
According to the official QuickSight pricing page (April 2026), Author pricing starts at $24 per user per month with capabilities including data transformation, dashboard creation, and seamless data source connection. Author Pro costs $40 per user per month. In regions where new Quick capabilities are available, Author and Author Pro users get promotional access to Quick Enterprise capabilities through December 31, 2026.
For AWS cost reporting specifically, teams build QuickSight dashboards that visualize CUR data by project, environment, team, or any custom tag. The serverless architecture means no infrastructure to manage.
Best use case: organizations already using AWS who need custom BI dashboards beyond what Cost Explorer provides. The learning curve exists, but the power and flexibility justify the investment for larger teams.
nOps: Automated AWS Cost Optimization

nOps positions itself as an end-to-end AWS cost reporting and optimization platform. According to market data, the platform helps users reduce costs by up to 60% through automated optimization.
The platform goes beyond reporting into active cost management. It identifies idle resources, recommends reserved instance purchases, rightsizes over-provisioned infrastructure, and automates savings plan management.
The value proposition: engineers get cost reporting dashboards without building them, plus automated optimization that runs continuously. For teams without dedicated FinOps resources, nOps provides that capability as a service.
Features include 100% AWS cost visibility, multicloud and SaaS cost tracking, container cost allocation, budget management, cost anomaly detection, and forecasting. The platform integrates with existing workflows through Slack, email, and API webhooks.
AWS CloudWatch: Real-Time Metrics and Logs

CloudWatch monitors AWS resources and applications in real-time. It collects metrics, logs, and events from every AWS service. While not purely a cost reporting tool, CloudWatch data connects directly to cost optimization.
High CPU utilization signals rightsizing opportunities. Low request counts on an RDS instance suggest over-provisioning. Network transfer metrics identify expensive cross-region traffic patterns.
CloudWatch Dashboards visualize these metrics alongside cost data from Cost Explorer or third-party tools. Teams set alarms for budget thresholds or usage anomalies. When metrics cross thresholds, automated responses can shut down dev environments or alert FinOps teams.
The platform charges based on metrics collected, logs ingested, and alarms configured. For production environments, the cost justifies itself through the operational visibility CloudWatch provides.
Amazon Analytics Services for Data Lakes
AWS provides a comprehensive set of analytics services beyond cost reporting. These tools process, analyze, and visualize data at scale for organizations building data lakes, running BI workloads, or implementing machine learning pipelines.
According to the AWS Analytics overview (published April 29, 2026), AWS offers a comprehensive set of capabilities for every analytics workload including streaming, SQL analytics, search, and business intelligence, with governance built in.
Streaming Analytics
Real-time data pipelines require specialized infrastructure. AWS offers four services for streaming analytics:
Amazon Data Firehose delivers the simplest path for loading streaming data into data lakes, warehouses, and analytics services. Amazon Kinesis provides lower-level control for custom stream processing. Amazon Managed Service for Apache Flink runs real-time analytics on streaming data using SQL or Java. Amazon MSK (Managed Streaming for Apache Kafka) provides fully managed Kafka clusters.
These services connect to reporting tools downstream. Stream data flows into S3, then QuickSight dashboards visualize it. Or Kinesis feeds real-time data into custom applications that generate operational reports.
Amazon Redshift: Data Warehouse for Analytics
Redshift powers data warehouse workloads at scale. According to an AWS case study published June 19, 2019, 3M Health Information Systems built a healthcare data reporting tool using Amazon Redshift as a petabyte-scale data warehouse solution for analyzing provider performance, quality outcomes, and cost savings.
The platform handles petabyte-scale datasets with SQL query performance optimized for analytical workloads. Teams load data from S3, transform it with SQL, and connect QuickSight or third-party BI tools for visualization.
For organizations with complex reporting requirements—multi-source data integration, historical trend analysis, regulatory compliance reports—Redshift provides the foundation. The managed service handles infrastructure scaling, backups, and performance tuning.
Choosing the Right Reporting Stack
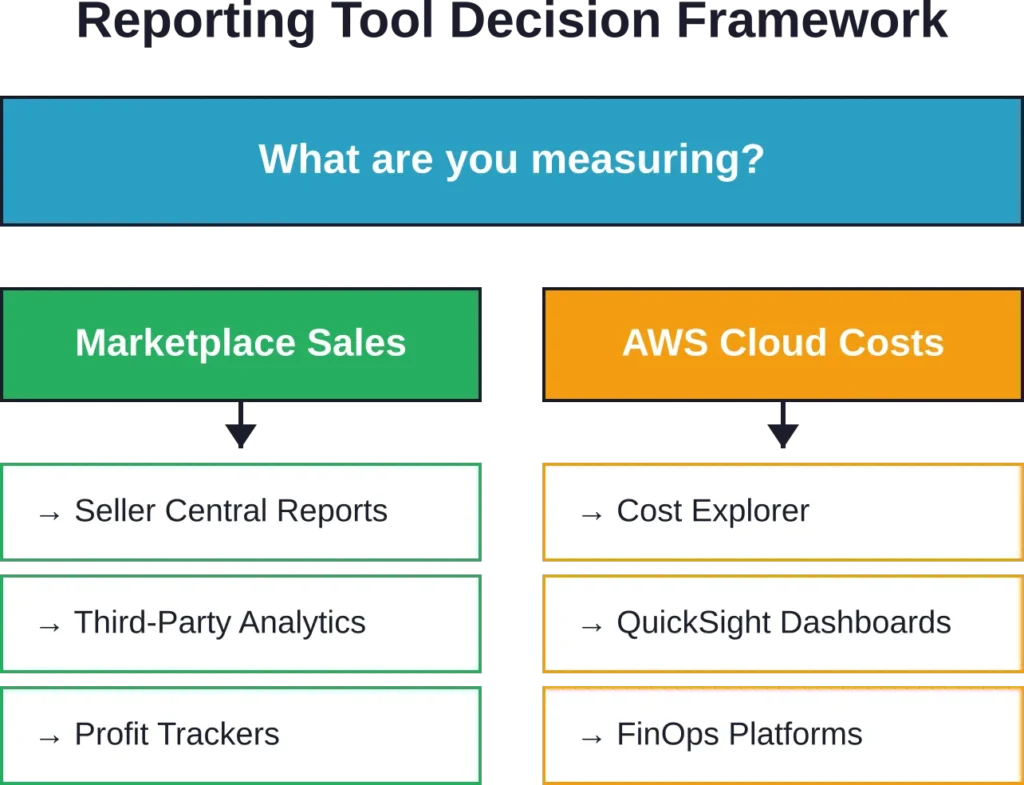
The best reporting tool depends entirely on what you’re measuring. A marketplace seller needs completely different capabilities than a DevOps engineer managing AWS infrastructure.
Start with these questions:
What decisions will this data inform? If you’re optimizing product listings, keyword research matters more than cost allocation. If you’re reducing cloud spend, rightsizing recommendations matter more than sales trends.
How technical is the team? Non-technical users need pre-built dashboards and automated insights. Technical teams can leverage raw APIs and build custom solutions.
What’s the budget? Native Amazon tools cost nothing but provide limited functionality. Third-party platforms add capabilities but charge monthly fees. Calculate the ROI: does the tool save more than it costs?
How fast do you need data? Some tools update in real-time. Others batch process once daily. Real-time costs more but matters for time-sensitive decisions like advertising bid adjustments or infrastructure scaling.
Seller Stack Recommendations
For new sellers testing product viability, start free. Use Seller Central native reports for the first 90 days. Add Jungle Scout ($49/month) when ready to expand beyond initial products.
For established sellers optimizing profitability, prioritize Sellerboard ($19/month) for real-time profit tracking. Add Helium 10 ($39/month) if SEO drives your traffic strategy.
For agencies managing multiple brands, invest in comprehensive platforms that support multi-account access and white-label reporting. The per-seat cost matters less than efficiency gains from consolidated dashboards.
AWS Stack Recommendations
For startups and small teams, Cost Explorer provides sufficient visibility until monthly AWS spend exceeds $5,000. At that threshold, consider QuickSight for custom dashboards or a third-party platform like nOps for automated optimization.
For mid-market companies with dedicated DevOps teams, export Cost & Usage Reports to S3 and build custom QuickSight dashboards. Implement tagging standards early—without consistent tags, cost allocation becomes impossible at scale.
For enterprises with complex multi-account structures, invest in third-party FinOps platforms that provide governance, showback, chargeback, and automated optimization. The platform cost becomes negligible compared to the waste it eliminates.
| User Type | Primary Need | Recommended Tool | Pricing |
|---|---|---|---|
| New Amazon Seller | Product research | Jungle Scout | $49/mo |
| Established Seller | Profit tracking | Sellerboard | $19/mo |
| SEO-Focused Seller | Keyword research | Helium 10 | $39/mo |
| B2B Seller | Business analytics | Amazon B2B Reports | Free |
| Small AWS User | Basic cost tracking | Cost Explorer | Free |
| AWS DevOps Team | Custom dashboards | QuickSight | $24-40/user |
| AWS Enterprise | Cost optimization | nOps or similar | Custom |
API Access and Automation
Manual reporting doesn’t scale. As operations grow, automated data pipelines become necessary. Both Amazon Seller and AWS platforms provide API access for programmatic reporting.
The Selling Partner API enables developers to automate marketplace report generation. According to Amazon Seller Central guidance, sellers can request reports, schedule reports, retrieve automatically generated reports, and cancel reports.
The current API version (v2021-06-30) operates across North America, Europe, and Far East regions. It requires specific role permissions including Inventory and Order Tracking, Pricing, Product Listing, and Finance and Accounting roles depending on report types accessed.
AWS provides similar API access for cost and usage data. The Cost Explorer API returns programmatic access to the same data visible in the console. Applications can retrieve cost forecasts, filter by custom dimensions, and integrate billing data into financial systems.
For teams with development resources, API automation eliminates manual export and import cycles. Reports generate automatically, data flows into databases, and dashboards update continuously without human intervention.
Third-Party Applications vs. Custom Development
The choice between buying a third-party tool and building custom automation depends on technical capability and specific requirements.
Third-party applications work immediately. No development time, no maintenance burden, instant access to pre-built reports and dashboards. The tradeoff: monthly subscription costs and limited customization.
Custom development provides unlimited flexibility. Build exactly what the business needs, integrate with internal systems, avoid per-user licensing fees. The tradeoff: upfront development time, ongoing maintenance responsibility, and technical debt.
Most organizations blend both approaches. Use third-party tools for standard reporting needs. Build custom integrations for unique business logic or specialized workflows.
Data Quality and Accuracy Considerations
Reporting tools are only valuable when the underlying data is accurate. Amazon’s native data is 100% accurate by definition—it’s the source of truth for billing, transactions, and service usage.
Third-party tools introduce accuracy risks. They pull data through APIs that may have delays, rate limits, or incomplete coverage. A tool might show yesterday’s sales but miss returns processed this morning. Or calculate profit margins using outdated fee structures.
Check these quality indicators when evaluating tools:
Data freshness: How often does the tool sync with Amazon? Real-time, hourly, daily? Delayed data makes time-sensitive decisions impossible.
Historical accuracy: Compare the tool’s historical reports against Amazon’s native data. Discrepancies signal calculation errors or incomplete data pulls.
Fee calculations: Amazon’s fee structure changes periodically. Does the tool update its formulas automatically or require manual configuration?
Multi-marketplace support: Sellers operating in multiple countries need tools that handle different currencies, tax rates, and fee structures accurately.
The safest approach: use Amazon’s native data as the validation baseline. If a third-party tool shows different numbers, trust Amazon’s data until you understand the discrepancy.
Security and Compliance
Granting third-party tools access to Amazon data creates security responsibilities. These platforms connect to your Seller Central account or AWS environment through API credentials that provide read access to sensitive information.
Evaluate security practices before connecting any tool:
Authentication method: OAuth-based connections provide better security than sharing username and password combinations. The tool should never ask for your Amazon password directly.
Permission scope: Grant minimum necessary permissions. A profit tracking tool needs order data but doesn’t need permission to modify listings or process refunds.
Data storage: Where does the tool store your Amazon data? Cloud-based platforms should encrypt data in transit and at rest. Understand retention policies—how long does the vendor keep your data?
Compliance certifications: For regulated industries or enterprise use, verify the vendor maintains relevant compliance certifications (SOC 2, ISO 27001, GDPR compliance).
AWS environments require additional scrutiny. Cost reporting tools need access to billing data, resource tags, and usage metrics. Use IAM roles with least-privilege policies. Enable CloudTrail logging to audit API calls. Regularly review and rotate access credentials.
Cost-Benefit Analysis of Reporting Tools
Reporting tools represent an operational expense. The investment makes sense when the insights they provide generate returns exceeding the subscription cost.
For marketplace sellers, calculate the profit impact. If Sellerboard costs $19/month but helps identify a product losing $200/month in hidden fees, the tool pays for itself immediately. If Helium 10 costs $39/month but discovers keyword opportunities that generate $500 in additional monthly revenue, the ROI is clear.
For AWS users, the math centers on cost reduction. If nOps costs $500/month but identifies $3,000 in wasted spend through rightsizing and reserved instance optimization, the net savings justify the expense.
The challenge: proving causation. Did sales increase because of better keyword research, or did the market improve? Did costs decrease because of the optimization tool, or did usage naturally decline?
Track baseline metrics before adding new tools. Measure changes after implementation. Control for external factors. The clearest ROI comes from tools that automate manual work—calculate the time saved and multiply by hourly cost.
Common Reporting Mistakes to Avoid
Organizations make predictable errors when implementing reporting systems. Learn from common pitfalls:
Tracking vanity metrics: Page views and impressions feel good but don’t drive business decisions. Focus on metrics that connect directly to profit or efficiency.
Ignoring data quality: Garbage in, garbage out. If product costs aren’t accurately tracked, profit reports are worthless. If AWS tags aren’t applied consistently, cost allocation fails.
Over-complicating the stack: More tools don’t necessarily mean better insights. Each additional platform adds integration complexity, learning curve, and subscription cost. Start simple, expand only when clear needs emerge.
Neglecting team training: The best reporting tool provides zero value if nobody knows how to use it. Budget time for onboarding, documentation, and ongoing training.
Analysis paralysis: Data becomes paralyzing when you have too much of it. Define key performance indicators upfront. Build dashboards around those metrics. Ignore everything else until priorities shift.
Forgetting mobile access: Decisions don’t wait for office hours. Choose tools with functional mobile apps or responsive web interfaces that work on tablets and phones.
Future Trends in Amazon Reporting
The reporting landscape evolves as Amazon’s platforms expand and technology advances. Several trends shape where the market moves:
AI-powered insights: According to AWS announcements, Amazon Q integration brings generative AI capabilities to QuickSight users. Natural language queries let non-technical users ask questions in plain English and receive chart-based answers. The technology eliminates the gap between data and decision-makers.
Real-time everything: Batch processing gives way to streaming analytics. Yesterday’s reports aren’t fast enough when competitor prices change hourly or ad campaigns drain budgets in minutes. Real-time dashboards become the baseline expectation.
Unified commerce reporting: Sellers operate across multiple marketplaces—Amazon, Walmart, Shopify, Target. Tools that aggregate data across channels provide comparative analytics and unified inventory management.
Predictive analytics: Historical reporting answers what happened. Predictive analytics answers what happens next. Machine learning models forecast demand, identify trending products before saturation, and predict inventory needs.
Privacy-first data handling: Regulations tighten around data collection, storage, and sharing. Reporting tools adapt with enhanced encryption, data residency options, and granular privacy controls.
Integration with Other Business Systems
Reporting tools provide maximum value when integrated into broader business workflows. Isolated dashboards require manual data transfer. Connected systems enable automation.
Common integration patterns include:
Accounting software: Export sales and expense data from Amazon reporting tools into QuickBooks, Xero, or NetSuite for consolidated financial reporting and tax preparation.
Inventory management: Connect sales forecasts from analytics platforms to inventory systems. Automate reorder triggers based on predicted demand rather than manual guesswork.
Marketing automation: Feed conversion rate and customer acquisition cost data from Amazon into marketing platforms to optimize ad spend across channels.
CRM systems: For B2B sellers, integrate Amazon Business customer data with Salesforce or HubSpot to track account relationships and purchase patterns.
Data warehouses: For enterprises, stream Amazon data into centralized data warehouses alongside data from other sources for comprehensive business intelligence.
API availability determines integration feasibility. Check whether tools provide documented APIs, webhooks, or pre-built connectors for your existing systems.
Frequently Asked Questions
Amazon seller reporting tools track marketplace metrics like sales, profit, inventory, and keyword rankings. AWS reporting tools monitor cloud infrastructure costs, resource usage, and service performance. They serve completely different user bases and measure unrelated data, despite both being Amazon platforms.
Amazon’s native reports provide raw transaction data but lack profit calculation, competitor intelligence, keyword research, and automated optimization. For basic tracking, native reports suffice. For competitive selling or cost optimization, third-party tools add capabilities Amazon doesn’t offer.
Seller analytics platforms range from free (limited features) to $199+ per month for comprehensive tools. Common price points: Sellerboard at $19/month for profit tracking, Helium 10 at $39/month for keyword research, Jungle Scout at $49/month for product research. AWS tools like Cost Explorer are free, while QuickSight starts at $24 per user monthly.
Accuracy depends on data source and calculation methodology. Amazon’s native data is 100% accurate as the authoritative source. Third-party tools can introduce errors through API delays, outdated fee calculations, or incomplete data syncing. Always validate third-party tool outputs against Amazon’s official reports initially.
Yes, through the Selling Partner API for marketplace sellers and Cost Explorer API for AWS users. Both platforms support programmatic report requests, scheduled generation, and automated data retrieval. Development resources are required to build custom automation, or third-party tools provide pre-built automation features.
Start with Amazon’s free native tools—Seller Central Business Reports for marketplace sellers and Cost Explorer for AWS users. These provide sufficient data to learn the platform without subscription costs. Add third-party tools once you identify specific gaps in native reporting that justify the expense.
Use OAuth authentication instead of sharing passwords, grant minimum necessary permissions, verify the vendor encrypts data in transit and at rest, check for compliance certifications, enable multi-factor authentication on your Amazon account, regularly audit API access, and review vendor security policies before connecting accounts.
Conclusion
Amazon reporting tools split into two distinct worlds. Marketplace sellers need profit visibility, keyword intelligence, and competitive analytics. AWS users need cost breakdowns, optimization recommendations, and resource monitoring.
Start with Amazon’s native solutions. Seller Central reports and Cost Explorer provide foundational data at no cost. Understand what you’re measuring and why it matters before adding paid tools.
Add third-party platforms strategically. Each tool should solve a specific problem Amazon’s native reporting leaves unaddressed. Profit tracking, keyword research, market intelligence, cost optimization—choose tools that deliver measurable returns.
The reporting landscape continues evolving. AI-powered insights, real-time analytics, and predictive capabilities become standard expectations. But the fundamentals remain constant: measure what matters, trust accurate data, and act on insights quickly.
Ready to improve your Amazon reporting? Start by auditing your current data sources. Identify the gaps between what you measure today and what decisions you need to make tomorrow. Then choose tools that close those gaps efficiently.