
Quick Summary: Facebook Ads reporting tools transform scattered campaign data into actionable insights by consolidating metrics from Meta Ads Manager, attribution platforms, and creative performance into unified dashboards. The best tools offer real-time data refresh, cross-channel integration, creative-level breakdowns, and automated reporting—with pricing ranging from free plans for small teams to enterprise solutions starting around $99/month for agencies managing complex attribution needs.
Running Facebook ad campaigns without proper reporting is like navigating a city with a blindfold. Sure, you’re moving. But where exactly? And at what cost?
Meta Ads Manager gives you data. Plenty of it, actually. But when campaigns scale beyond a handful of ad sets—when creative variations multiply, when attribution gets messy, when stakeholders demand answers across channels—the native dashboard starts showing cracks.
That’s where dedicated reporting tools come in. They don’t just organize numbers. The good ones surface patterns, automate tedious exports, and connect the dots between creative decisions and revenue outcomes.
This guide breaks down the Facebook ads reporting tools that actually matter in 2026. Not every platform on the market—just the ones teams use to make faster, smarter decisions.
Why Meta Ads Manager Isn’t Enough Anymore
Meta Ads Manager works fine for simple setups. A few campaigns, straightforward objectives, one person checking performance daily.
But scale introduces friction.
When managing dozens of video ad variations, the native interface doesn’t map creative elements to performance. Which hook drives conversions? Which scene triggers drop-off? Ads Manager won’t tell you. It shows aggregate metrics by ad ID, not by the creative components inside.
Cross-channel attribution becomes a puzzle. If customers see a Facebook ad, click a Google search ad, then convert via email, where does the credit go? Ads Manager uses last-click by default—a model that often misrepresents reality.
Data exports turn into manual labor. Pulling weekly reports means downloading CSVs, cleaning column headers, merging files, building pivot tables. Every single week. That’s hours spent on grunt work instead of strategy.
Real-time visibility disappears. Ads Manager updates throughout the day, but comparing today’s 10 a.m. snapshot to yesterday’s requires mental math or saved views. No historical overlays. No automated alerts when performance dips.
The tool wasn’t designed for teams juggling hundreds of creatives, multi-touch attribution, and stakeholder presentations. It’s a control panel, not an analysis engine.
Stop Testing Losers and Predict Winning Ads
Extuitive helps brands and agencies maximize their advertising budget by eliminating guesswork from the creative process. It is an AI-powered platform designed to forecast ad performance before a single dollar is spent on media, making it a powerful addition to any Facebook ads reporting stack. Instead of simply reviewing past losses in a report, it uses predictive models validated against real-world campaign data to ensure only high-performing creatives go live.
- Pre-launch Performance Forecasting: Predicts metrics like CTR and ROAS using AI models trained on over 150,000 simulations.
- Creative Validation: Analyzes ad copy, imagery, and video structure to score them against historical performance data.
- Intelligent Audience Targeting: Identifies the specific segments most likely to convert based on Shopify store data and consumer behavioral models.
- Scalable Ad Testing: Allows teams to test large volumes of ad variations instantly to find winners before going live.
- Automated Best Practices: Checks if creatives meet platform-specific requirements for quality and brand visibility.
Book a demo to see how Extuitive can increase your return on ad spend.
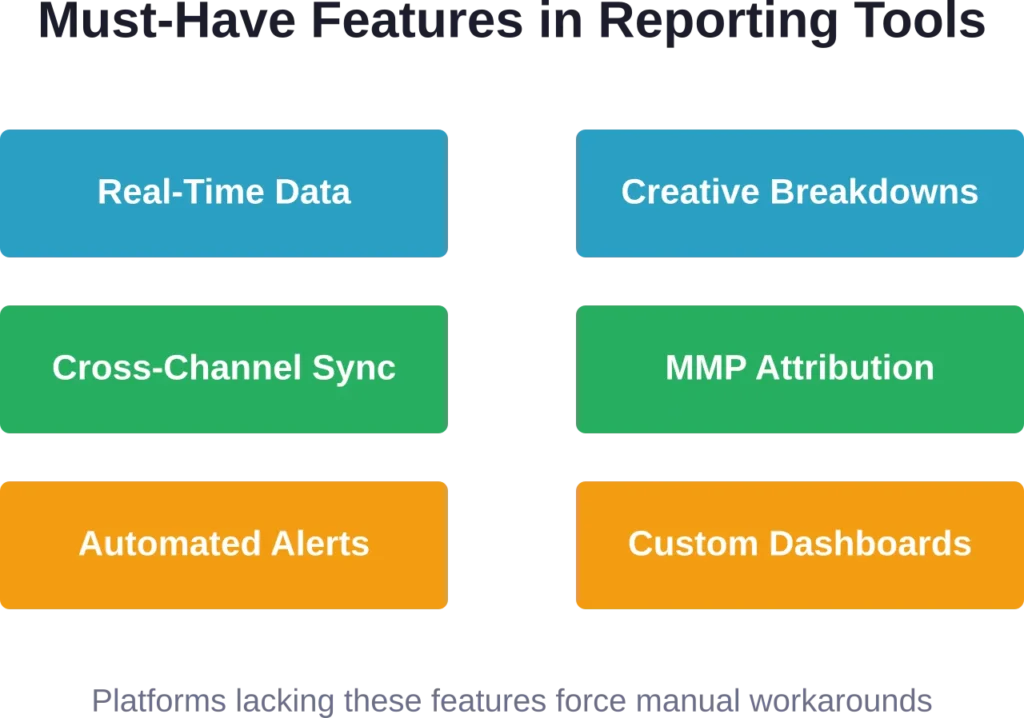
Core Features That Separate Good Tools from Noise
Not all reporting platforms solve the same problems. Some focus on creative analytics. Others specialize in attribution or funnel mapping. A few try to do everything and end up mediocre at all of it.
Here’s what actually matters when evaluating options.
Real-Time Data Refresh
Decisions made on stale data are just expensive guesses. Weekly updates don’t cut it when ad fatigue can tank performance in 48 hours.
Look for platforms that sync hourly or support manual refresh on demand. Current data means catching problems before they compound and scaling winners while momentum lasts.
Creative-Level Breakdowns
This is where most tools fail. They report on campaigns, ad sets, and individual ads—but not the components within each creative.
Tag-level mapping changes that. Platforms like Segwise let teams tag hooks, scenes, headlines, and CTAs separately, then surface which elements consistently drive ROAS. Discover that a specific opening line appears in 80% of top performers, and now there’s a replicable insight instead of vague intuition.
Cross-Channel Integration
Facebook doesn’t exist in a vacuum. Most teams run Google Ads, TikTok, email campaigns, maybe influencer partnerships. Siloed reporting hides the full customer journey.
The best tools pull data from multiple ad platforms, CRMs, and attribution sources into one dashboard. See how Facebook fits into the bigger funnel instead of treating it as an isolated channel.
Attribution Clarity
Last-click attribution lies. First-click overvalues awareness. Multi-touch models get closer to truth, but only if the reporting tool actually connects to your MMP (mobile measurement partner) or attribution provider.
Integration with platforms like Adjust, AppsFlyer, or Triple Whale means reports reflect genuine contribution, not arbitrary credit assignment.
Automated Reporting and Alerts
Manual report generation is a time sink. Automated delivery—daily emails, Slack notifications, scheduled dashboard links—keeps stakeholders informed without anyone babysitting exports.
Alerts matter even more. Set thresholds for CPA spikes, ROAS drops, or budget pacing, and get notified the moment something breaks. Reactive fixes are expensive. Proactive catches save budgets.
Categories of Facebook Ads Reporting Tools
The market splits into a few distinct categories. Each solves different pain points.
All-in-One Marketing Dashboards
These platforms aggregate data from Facebook, Google, TikTok, email, and more into unified views. Think of them as command centers for multi-channel campaigns.
They excel at breadth but sometimes sacrifice depth. Cross-platform visibility is excellent. Creative-level granularity? Often shallow.
Best for agencies managing diverse client portfolios or brands running heavy omnichannel strategies.
Creative Analytics Platforms
Tools built specifically to dissect ad creative performance. They tag visual elements, copy variations, and production styles, then correlate those tags with conversion data.
Segwise is a strong example here—tag-level creative element mapping reveals which specific components (hooks, scenes, headlines) drive results. Patterns like “this dialogue appears in 80% of top-performing creatives” become visible with complete MMP attribution integration.
These platforms answer questions Ads Manager can’t: which creative variables consistently win? Where does creative fatigue start? What production choices correlate with higher ROAS?
Best for performance teams running high volumes of video or image ad variations.
E-Commerce Attribution Dashboards
Focused on DTC brands and online retailers, these tools emphasize revenue metrics—CAC, LTV, cohort analysis, repeat purchase rates.
They connect ad spend to actual sales, not just leads or clicks. Polar Analytics sits in this category, with GMV-based pricing that only makes sense at certain revenue scales.
Best for e-commerce brands where the entire funnel lives online and attribution directly ties to transactions.
Enterprise Data Warehouses
Platforms like Supermetrics or Funnel.io don’t provide dashboards—they pipe data into your existing BI stack (Looker, Tableau, Power BI).
Massive flexibility. Total control. But also requires in-house analytics talent to build and maintain custom views.
Entry-level plans start around $99/month and scale into enterprise pricing in the thousands. Overkill for small businesses. Invaluable for large enterprises or agencies with complex data consolidation needs.
Best for teams with dedicated data analysts who need raw data feeds, not pre-built dashboards.
Top Facebook Ads Reporting Tools Worth Evaluating
Here’s a breakdown of platforms that solve real problems. Not an exhaustive list—just the ones teams actually use.
Segwise

Built for performance marketers who need to understand which creative elements drive results.
Tag hooks, scenes, CTAs, and headlines individually. Segwise maps those tags to performance data and surfaces patterns. See that a specific opening line consistently outperforms alternatives, or that certain background colors correlate with higher engagement.
MMP attribution integration means the data reflects actual conversions, not just clicks. Real-time filtering and segmentation make it easy to slice data for stakeholder presentations. Entry-level pricing starts at $9 per user, per project, per month for team collaboration.
Best for teams managing dozens of video ad variations and struggling with creative fatigue.
Supermetrics

A data connector, not a dashboard. Pulls Facebook Ads data into Google Sheets, Excel, Looker, BigQuery, or any BI tool that accepts API inputs.
Automation is the draw here. Schedule daily or hourly data refreshes. Build custom reports once, then let Supermetrics keep them updated without manual exports.
No visualization layer—teams build their own charts and tables. That’s a strength for analytics teams who know exactly what they want. A weakness for marketers who need plug-and-play dashboards.
Best for companies with in-house data teams that prefer control over convenience.
Funnel.io

Another data pipeline tool. Connects 500+ marketing platforms (Facebook, Google, TikTok, Shopify, HubSpot) and feeds clean, normalized data into BI tools or data warehouses.
The differentiator is data transformation. Funnel.io doesn’t just move data—it standardizes column names, currency conversions, and metric definitions so cross-platform comparisons actually work.
Serves 17,000+ customers and reports on >10% of global ad spend.
Pricing reflects enterprise positioning. Plans start around $99/month for basic connectors but climb quickly as data sources multiply.
Best for agencies or brands managing massive ad budgets across fragmented platforms.
Triple Whale

E-commerce focused. Integrates Facebook Ads with Shopify, Google Analytics, and attribution platforms to show real-time profit metrics.
The dashboard emphasizes actionable KPIs—net profit, blended ROAS, customer acquisition cost. Less focus on vanity metrics like impressions or reach.
Free forever plan available for up to three data sources. Paid plans start at $49/month for expanded integrations and historical data access.
Best for DTC brands that need to track ad spend against actual revenue and profit margins.
Porter Metrics

Agency-friendly reporting automation. Builds white-label dashboards with client branding, pulls data from Facebook and other ad platforms, and delivers scheduled reports via email or shareable links.
Responsive customer support and affordable pricing make it accessible for smaller agencies. Plans range from free to $598/month.
Not as deep on creative analytics or attribution nuance, but solid for client-facing performance summaries.
Best for agencies that need branded, automated reporting without heavy setup overhead.
Polar Analytics

Premium e-commerce attribution platform. Tracks CAC, LTV, cohort behavior, and multi-channel contribution with tight Shopify integration.
GMV-based pricing starts at $720/month—definitely not entry-level. The tool only makes sense for brands doing significant revenue where attribution accuracy directly impacts budget allocation.
Best for mid-to-large e-commerce companies obsessed with precise attribution and customer lifetime value modeling.
Motion

Focuses on creative performance and workflow. Helps teams organize ad variations, tag creative elements, and identify which concepts drive performance.
The platform emphasizes collaboration—designers, copywriters, and media buyers work in the same environment, commenting on creatives and tracking iteration history.
Pricing isn’t prominently disclosed on basic plan pages; check their official website for current tiers.
Best for creative-heavy teams that treat ad production as a core competitive advantage.
| Platform | Best For | Pricing Starts At | Key Strength |
|---|---|---|---|
| Segwise | Creative analytics | $9/user/project/month | Tag-level creative mapping with MMP integration |
| Supermetrics | Data pipelines to BI tools | ~$99/month | Automated data connectors for custom dashboards |
| Funnel.io | Enterprise data consolidation | ~$99/month | Normalized cross-platform data at scale |
| Triple Whale | E-commerce profit tracking | Free (3 sources); $49/month paid | Real-time profit and blended ROAS metrics |
| Porter Metrics | Agency client reporting | Free to $598/month | White-label automated dashboards |
| Polar Analytics | Premium e-commerce attribution | $720/month (GMV-based) | LTV and cohort analysis with Shopify sync |
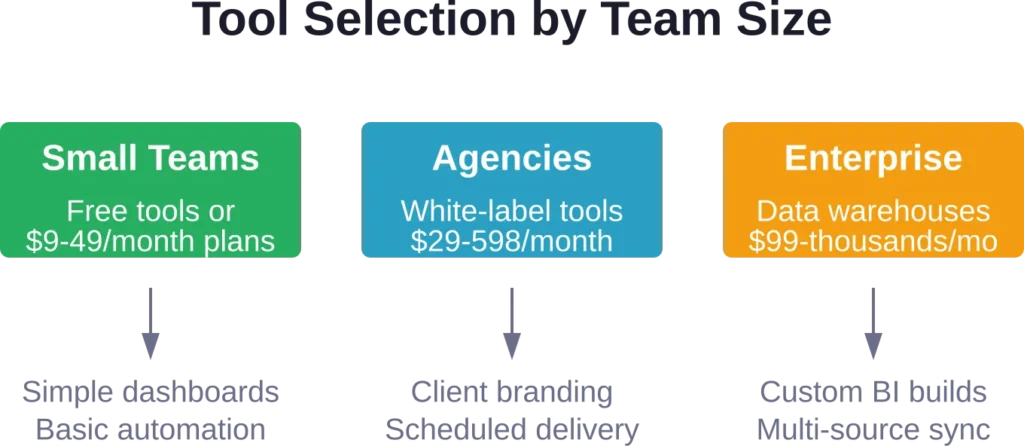
How to Pick the Right Tool for Your Situation
No single platform wins for everyone. The right choice depends on team size, campaign complexity, and what questions need answering.
For Small Teams or Solo Advertisers
Start with free or low-cost options. Triple Whale’s free plan handles three data sources—often enough for a single Facebook account plus Shopify and Google Analytics.
If creative iteration is central to strategy, consider Segwise’s entry-level plan. At $9 per user per project per month, it’s accessible without enterprise commitment.
Avoid over-engineering. A simple Google Sheets dashboard fed by Supermetrics beats an expensive enterprise tool sitting unused.
For Agencies Managing Multiple Clients
White-label reporting matters here. Clients want branded dashboards, not generic templates with competitor logos.
Porter Metrics or similar agency-focused platforms streamline client communication. Automated delivery means less time exporting CSVs, more time optimizing campaigns.
Pricing often scales with client count or data volume.
For E-Commerce Brands
Attribution accuracy directly impacts profitability. Platforms that integrate with Shopify, track customer cohorts, and calculate true ROAS (accounting for repeat purchases and refunds) are non-negotiable.
Triple Whale works for smaller stores. Polar Analytics makes sense once revenue scales past the point where $720/month is a rounding error compared to ad spend.
Don’t ignore creative analytics. Even with perfect attribution, if ads fatigue quickly because teams can’t identify winning elements, ROAS suffers.
For Enterprise Teams or Large Agencies
Data consolidation becomes the bottleneck at scale. Hundreds of campaigns across Facebook, Google, TikTok, Pinterest, programmatic—plus CRM data, offline conversions, and call tracking.
Funnel.io or Supermetrics feed everything into a centralized data warehouse. From there, BI teams build custom dashboards tailored to specific stakeholder needs.
Entry-level enterprise plans start around $99/month and climb into thousands as connectors and data volume increase. That’s expected—these tools consolidate workflows that would otherwise require multiple platforms and manual reconciliation.
Data Quality Matters More Than Features
Here’s the uncomfortable truth: fancy dashboards built on messy data produce confident, wrong decisions.
Reporting tools visualize information. They don’t fix broken tracking, reconcile duplicate conversions, or filter bot traffic. Garbage in, garbage out.
Before committing to a platform, audit data hygiene. Are Facebook pixels firing correctly? Do conversion events match server-side tracking? Are UTM parameters consistent across campaigns?
Some platforms help with this—Segwise and similar tools include data validation layers. But most assume clean inputs.
Investing in reporting infrastructure without first ensuring accurate data collection is like buying expensive cookware but never washing the ingredients. The tools are fine. The outcome still disappoints.
Common Mistakes Teams Make When Choosing Reporting Tools
Picking Based on Features Instead of Problems
A tool with 50 integrations sounds impressive. But if campaigns only run on Facebook and Google, 48 of those connectors are irrelevant.
Start with the questions that need answering. Which creatives drive conversions? Where does budget leak? How does Facebook contribute to multi-touch journeys?
Then find tools that answer those specific questions. Feature checklists seduce teams into over-buying.
Ignoring Learning Curves
Enterprise platforms with deep customization require time to configure. If teams don’t have bandwidth for setup and training, simpler tools deliver faster value.
Supermetrics offers incredible flexibility—but only if someone knows how to build dashboards in Google Sheets or BI tools. For teams without that skill, pre-built solutions like Triple Whale or Porter Metrics remove friction.
Underestimating Integration Complexity
Connecting Facebook Ads is usually straightforward. Adding attribution platforms, CRMs, and offline conversion sources gets messy.
Check integration documentation before committing. Does the tool natively support necessary platforms, or will custom API work be required? Who maintains those connections when APIs change?
Forgetting About Stakeholder Needs
Analysts want granular data. Executives want summaries. Clients want branded PDFs.
A tool perfect for internal analysis might fail at client communication. Porter Metrics excels at white-label reports but lacks deep creative breakdowns. Segwise delivers creative insights but isn’t optimized for client-facing exports.
Map stakeholder requirements before selecting. Sometimes two tools—one for analysis, one for reporting—beats a single compromise platform.
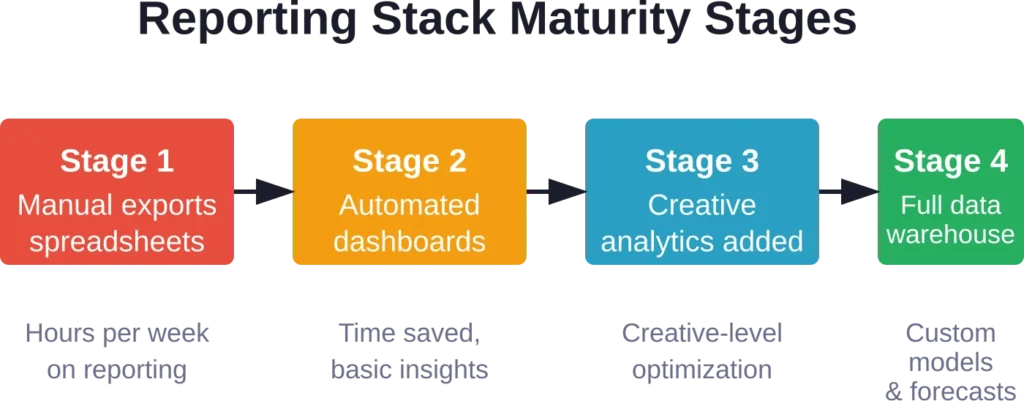
Building a Reporting Stack That Scales
Most teams eventually use multiple tools. A centralized dashboard for executives. A creative analytics platform for media buyers. Data connectors feeding a warehouse for analysts.
That’s not redundancy—it’s specialization.
Start simple. One tool that solves the biggest immediate pain. For many teams, that’s automating weekly client reports or surfacing which ad creatives fatigue first.
Add layers as needs clarify. Once automated reporting runs smoothly, creative analytics might be the next unlock. After that, maybe deeper attribution modeling.
Avoid the trap of trying to build the perfect stack upfront. Requirements change. Platforms evolve. What works at $50k/month ad spend breaks at $500k.
Flexibility matters more than perfection.
Best Practices for Getting Value from Reporting Tools
Define North Star Metrics First
Dashboards tempt teams to track everything. Impressions, clicks, CTR, CPC, CPM, frequency, reach, video completion rates—the list multiplies.
But what actually matters? For e-commerce, probably ROAS and CAC. For lead gen, cost per qualified lead. For brand awareness, maybe incrementality studies (though those require specialized measurement).
Pick 3-5 metrics that directly tie to business outcomes. Build dashboards around those. Everything else is context, not priority.
Schedule Regular Audits
Reporting accuracy degrades over time. Pixels break. API connections timeout. Platform updates change column definitions.
Monthly spot checks catch issues before they compound. Compare dashboard totals to native platform numbers. Investigate discrepancies immediately.
Small drift is expected—platforms update conversion windows or attribution models. Large gaps signal broken tracking.
Train the Whole Team
A reporting tool only delivers value if people use it. That sounds obvious, but many teams buy platforms only analysts understand.
If media buyers can’t pull creative performance reports themselves, they’ll keep asking analysts for exports. That defeats the automation purpose.
Invest in onboarding. Build templates. Document workflows. The goal is self-service insights, not centralized bottlenecks.
Iterate Dashboard Design
First drafts always miss something. Metrics get ignored. Filters prove unnecessary. Stakeholders ask questions the dashboard can’t answer.
Treat dashboards like products. Gather user feedback. Adjust layouts. Remove clutter. Add missing dimensions.
The best dashboards evolve through use, not upfront planning.
Frequently Asked Questions
Facebook-specific tools focus deeply on Meta platform metrics, creative performance, and ad-level breakdowns. General marketing dashboards aggregate data across channels (Google, TikTok, email) but often lack granular creative insights. Teams running heavy Facebook spend benefit from specialized tools. Those managing omnichannel campaigns need broader aggregation.
Free plans work well for small teams with simple needs. Triple Whale’s free tier handles up to three data sources—enough for a single Facebook account, Shopify, and Google Analytics. Limitations emerge at scale: restricted historical data, fewer integrations, manual export requirements. For solo advertisers or early-stage brands, free tools deliver real value. Agencies or high-spend accounts quickly hit limits.
Critical for performance campaigns where budgets shift daily. Ad fatigue can tank ROAS in 48 hours—weekly reports catch problems too late. Real-time (or hourly) refresh enables proactive optimization. For brand awareness campaigns with longer feedback cycles, daily updates suffice. Match refresh frequency to decision cadence.
No tool fully solves attribution gaps from Apple’s App Tracking Transparency. But platforms that integrate with MMPs (mobile measurement partners) like Adjust or AppsFlyer provide more accurate post-install data than Facebook’s native tracking. Server-side conversion APIs and incrementality testing also help. Reporting tools surface the data available—they don’t create data that privacy restrictions block.
White-label capabilities, automated client delivery, and scalable pricing. Clients expect branded dashboards, not generic templates. Automated weekly or daily reports reduce manual busywork. Pricing that scales with client count prevents runaway costs as the agency grows. Responsive support also matters—when client calls come in, the reporting tool needs to work.
Standard tools report metrics by campaign, ad set, or ad ID. Creative analytics platforms tag individual elements within ads—hooks, scenes, CTAs, headlines—and correlate those tags with performance. This reveals which creative components consistently drive results, enabling systematic creative iteration instead of guesswork. Platforms like Segwise specialize here, mapping creative variables to MMP-attributed conversions.
Depends on complexity and budget. Small teams benefit from all-in-one simplicity—one login, one subscription, less integration headache. Larger teams often need specialization: a data warehouse for raw feeds, a creative platform for ad analysis, a client-facing tool for reports. Multiple tools introduce overhead but deliver deeper capability in each domain. Start simple, add specialization as specific needs clarify.
Making the Decision
Choosing a Facebook Ads reporting tool isn’t about finding the objectively best platform. It’s about matching capabilities to actual workflow pain.
If creative fatigue is the recurring problem, creative analytics platforms solve it. If client reporting consumes hours weekly, automated white-label tools reclaim that time. If attribution is murky, tools with MMP integration clarify contribution.
Trial periods exist for a reason. Most platforms offer free tiers or 14-day demos. Test the workflow. Build a dashboard. See if stakeholders actually use it.
The tool that looks perfect in a feature comparison might feel clunky in daily use. The one that seems limited might answer every question that actually gets asked.
Data quality matters more than features. Clean tracking beats fancy visualizations. Accurate attribution beats real-time refresh of wrong numbers.
Start with fundamentals. Ensure pixels fire correctly. Reconcile conversion discrepancies. Standardize naming conventions. Then layer reporting tools on top.
The best reporting tool is the one teams actually open every day—not the one with the longest feature list gathering dust after the initial setup excitement fades.
Ready to see which creative elements drive your Facebook Ads performance? Explore platforms with creative-level breakdowns and MMP attribution to stop guessing and start optimizing with real data.